Introduction
Condition monitoring equipment forms the foundation of modern predictive maintenance programs across manufacturing, energy, aerospace, and process industries. Yet many maintenance teams struggle to select the right approach — not all techniques detect the same failure modes, and deploying the wrong method leads to missed faults, wasted budget, or false confidence in equipment health.
Unplanned downtime costs US manufacturers up to $207 million per week, with average hourly costs reaching $400,000. Despite this financial risk, only 13% of manufacturers have adopted condition monitoring.
This article breaks down the main types of condition monitoring equipment and techniques, how each works, and the factors that guide better selection decisions for your facility.
Key Takeaways
- Condition monitoring tracks equipment health in real time using sensors and inspection techniques to detect faults before failures occur
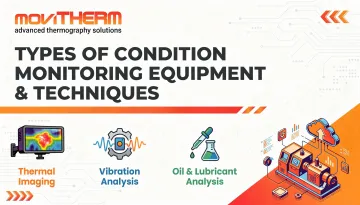
- Five techniques dominate industrial programs: vibration analysis, infrared thermography, ultrasonic monitoring, oil analysis, and electrical monitoring
- No single technique covers every failure scenario. Effective programs combine two or more complementary methods.
- Selection depends on asset type, targeted failure modes, inspection frequency, access constraints, and team expertise
- Thermal imaging stands out for speed and wide-area coverage across electrical and mechanical systems
What Is Condition Monitoring Equipment?
Condition monitoring equipment consists of sensors, instruments, and software tools used to continuously or periodically measure operating parameters of industrial assets — vibration, temperature, pressure, acoustic emissions — and flag deviations before they become failures.
CM equipment spans two broad categories:
- Permanently installed online sensors that collect data continuously (vibration transmitters, fixed thermal cameras, inline oil sensors)
- Portable inspection tools used by technicians on route-based schedules (handheld vibration analyzers, ultrasonic detectors, thermal imaging cameras)
The equipment itself doesn't make maintenance decisions — it supplies the measurement data that makes those decisions defensible. Think of it as the sensing infrastructure underneath any predictive or condition-based maintenance (CBM) program, whether the assets involved are rotating machinery, electrical systems, or structural components.
Why Condition Monitoring Matters in Industrial Maintenance
Equipment degradation rarely happens suddenly. Most failures develop over time through measurable physical changes — heat buildup from electrical resistance, vibration signatures from bearing wear, acoustic emissions from lubrication breakdown. Condition monitoring equipment exists to detect these changes early, before they become unplanned shutdowns or safety incidents.
A 2025 Fluke survey found that 55% of US manufacturers experienced unplanned downtime in the past year, with nearly 50% reporting 6-10 incidents per week. Single incidents can reach $13.8 million to $42.6 million in losses.
Without condition monitoring, maintenance teams default to two approaches:
- Time-based preventive maintenance — changing components on fixed schedules, often replacing healthy equipment unnecessarily
- Reactive maintenance — fixing assets after failure, exposing operations to unplanned downtime, safety risks, and secondary damage
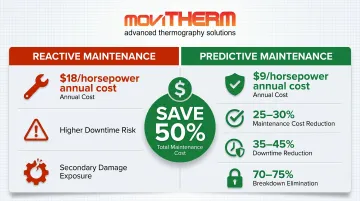
Both carry a real cost. The U.S. Department of Energy documents that reactive maintenance costs $18 per horsepower annually, compared to $9 for predictive maintenance, double the cost of predictive approaches. Predictive programs reduce maintenance costs by 25-30%, downtime by 35-45%, and eliminate 70-75% of breakdowns.
The fundamental problem with time-based maintenance: 82-90% of equipment follows random failure patterns, not age-related wear-out, according to RCM research by Nowlan and Heap. That's precisely why monitoring actual equipment condition — rather than counting calendar days — is what separates effective predictive programs from maintenance schedules that guess.
Types of Condition Monitoring Equipment and Techniques
Condition monitoring is not one-size-fits-all. The right technique depends on the failure mode being targeted, asset type, operating environment, and detection window needed. Different techniques detect problems at different stages of the failure timeline.
Vibration Monitoring
Vibration monitoring measures frequency, amplitude, and pattern of mechanical motion using accelerometers or proximity sensors mounted directly on rotating equipment. It detects problems like imbalance, misalignment, bearing wear, looseness, and gear defects — faults that appear first as changes in vibration signature.
How it works:
- Proximity probes (eddy current sensors) measure relative shaft displacement, ideal for fluid-film bearings and turbines operating from DC (0 Hz) to ~10 kHz
- Accelerometers (piezoelectric sensors) measure absolute casing vibration in the 2,000 Hz to 20+ kHz range, excellent for high-speed equipment and early bearing fault detection
- Velocity sensors measure absolute casing vibration from 10 Hz to 2,000 Hz, suited for rolling element bearing machines and motors at 3,600 RPM or less
Spectrum analysis and acceleration enveloping are effective tools for detecting early stages of bearing failure caused by local defects.
Best-fit applications:
- Motors, pumps, fans, compressors, gearboxes, turbines
- Continuous process industries where assets run 24/7
- High-speed rotating equipment above 120 RPM
Key strengths: Wide fault detection coverage for rotating machinery; proven diagnostic capability with mature analysis techniques.
Limitations: Less effective for slow-speed equipment below ~120 RPM without high-sensitivity accelerometers; variable operating conditions require advanced signal processing; typically detects bearing problems at Stage 3 (progressive wear) rather than Stage 1-2 (early fatigue).
Infrared Thermography
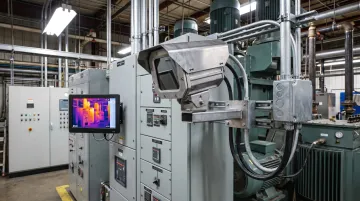
Infrared thermography uses thermal imaging cameras to detect heat signatures across equipment surfaces without physical contact. Thermal cameras capture infrared radiation and convert it into a visual image, revealing hot spots caused by friction, electrical resistance, insulation breakdown, or lubrication failure — before physical damage occurs.
How it works:
Thermal cameras measure surface temperature by detecting infrared radiation in the 3-14 μm wavelength range. Operators scan equipment during operation, identifying temperature anomalies that indicate developing faults. Fixed thermal camera systems provide continuous 24/7 monitoring with automated alerts.
Best-fit applications:
- Electrical panels, switchgear, motors, transformers
- Bearings, couplings, and mechanical drive systems
- Process pipelines, heat exchangers, refractory linings
- Industrial fire detection and perimeter monitoring
Key strengths:
- Non-contact inspection requires no production shutdown
- Covers wide areas rapidly — entire electrical panels scanned at walking speed
- Detects thermal anomalies invisible to other techniques
- Safe inspection with no ionizing radiation
NFPA data shows electrical distribution equipment is the #1 ignition source in industrial fires, causing an estimated 36,784 fires annually at industrial properties with $1.5 billion in property damage. NFPA 70B now mandates annual infrared thermographic inspections of all electrical equipment.
Fixed thermal camera systems — such as the FLIR A-Series and Optris PI/Xi series — go further than periodic inspections. Permanently installed and connected to cloud monitoring platforms, they deliver 24/7 automated surveillance with real-time alerts, turning thermography into a continuous condition monitoring layer rather than a scheduled task.
Limitations: Surface-only detection; cannot see internal component wear. Emissivity variation affects measurement accuracy. Requires line-of-sight access to target surfaces.
Ultrasonic and Acoustic Monitoring
Ultrasonic monitoring detects high-frequency sound waves — above the range of human hearing (typically 20-100 kHz) — generated by leaks, friction, arcing, or material stress. It works in two modes:
- Airborne ultrasound — detects leaks in pressurized or vacuum systems by capturing turbulent flow noise
- Structure-borne ultrasound — detects early bearing wear or lubrication issues through contact with the asset
How it works:
Ultrasonic detectors convert high-frequency sound into audible or visual signals. Technicians use contact probes for structure-borne detection or directional sensors for airborne leaks.
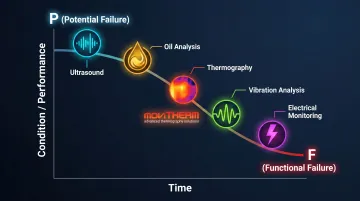
Ultrasound sits at the apex of the P-F curve — the point farthest from functional failure — giving maintenance teams the maximum available lead time for corrective action.
Best-fit applications:
- Compressed air systems, steam traps, pneumatic valves
- Bearings at early wear stages (Stage 1-2 lubrication failure)
- Electrical switchgear (detecting corona and arcing)
Key strengths:
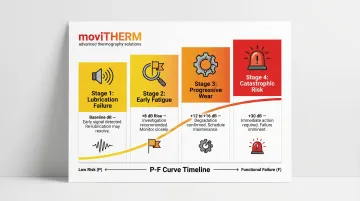
Ultrasound detects bearing faults **weeks or months before vibration analysis** shows symptoms. Research by IVC Technologies shows ultrasound identifies Stage 1 (lubrication failure) and Stage 2 (early fatigue) bearing faults while vibration analysis typically detects problems only at Stage 3 (progressive wear).
SDT Ultrasound documents that a +8 dB increase over baseline indicates investigation is needed; +12 to +16 dB confirms bearing degradation; +30 dB signals potential catastrophic failure.
For compressed air systems, leaks waste 20-30% of compressor output according to the U.S. Department of Energy. An ultrasonic leak survey typically finds $10,000 to $50,000 in annual energy savings per facility.
Limitations: Point-measurement technique requiring physical proximity to each asset. Time-intensive for large asset populations compared to wide-area methods like thermal imaging. Requires skilled interpretation. Environmental noise can interfere with airborne readings.
Oil and Lubricant Analysis
Oil analysis examines lubricant samples — either through inline sensors or laboratory testing — to measure fluid condition, contamination levels, and the presence of wear particles. Degraded or contaminated lubricant indicates component wear, moisture ingress, or overheating even when no external symptoms are visible.
How it works:
Laboratory analysis uses techniques like spectrometry (elemental wear particle identification), viscosity testing, particle counting (ISO 4406 standards), and acid/base number measurement. Inline sensors use dielectric constant measurement, capacitance sensing for humidity, and coil-wound technology for ferrous/non-ferrous debris detection.
Best-fit applications:
- Gearboxes, hydraulic systems, engines, compressors
- Any equipment where lubricant condition directly drives component longevity
Key strengths:
Early detection of internal wear not visible by other techniques. Noria Corporation research shows improper lubrication leads to 43% of mechanical failures and 54% of bearing failures. Oil analysis catches these problems before physical damage occurs.
A mining equipment case study found oil changes were performed when only 25% of the oil's useful life had been consumed; transitioning to condition-based monitoring saved approximately $40,000 per asset per year.
Limitations: Lab-based analysis introduces time lag (days to weeks for results). Inline sensors provide real-time trend data but cannot match laboratory analytical precision. Proper sampling technique is critical — contamination from poor practices can generate false positives.
Electrical and Motor Monitoring
Electrical monitoring measures current, voltage, power quality, and insulation resistance to detect imbalances, overloads, insulation degradation, and winding faults in motors, drives, and electrical distribution systems.
Key techniques include:
- Motor Circuit Analysis (MCA) — offline testing (motor de-energized) measuring resistive, inductive, and capacitive response to detect winding faults
- Electrical Signature Analysis (ESA/MCSA) — online testing (motor running) using FFT spectral analysis to detect rotor bar defects, eccentricity, bearing faults, and load issues
- Insulation Resistance Testing — offline measurement of winding insulation degradation
- Power Quality Monitoring — online detection of voltage imbalance, harmonics, transients, and power factor issues
Best-fit applications:
- Electric motors, variable frequency drives, switchgear, control panels
- Transformers and electrical distribution equipment
Key strengths:
Direct detection of electrical faults that cause overheating, fires, or sudden failure. EPRI studies of 4,797 motors found stator/winding faults caused ~27.7% of failures and bearing issues caused ~24.1%. IEEE studies showed maintenance frequency <12 months resulted in failure rates 7x lower than maintenance frequency >25 months.
IntechOpen research estimates combining motor current signature analysis (MCSA) with vibration analysis can detect or prevent approximately 80% of motor failures.
Limitations: MCA and insulation resistance testing require briefly taking the asset offline, which is not always feasible. ESA/MCSA provides online monitoring but requires specialist interpretation of frequency spectra.
How to Choose the Right Condition Monitoring Technique
The "right" technique is determined by the failure mode you need to detect, not by what is most familiar or most marketed. Start by identifying which failure modes pose the greatest risk to each asset — bearing wear, insulation breakdown, lubricant contamination, thermal stress — then match the technique to those failure modes.
Match Technique to Asset Type and Operating Profile
- Rotating machinery at high speed (>120 RPM): Vibration analysis excels
- Electrical systems and thermal assets: Infrared thermography provides wide-area, non-contact inspection
- Low-speed or heavily lubricated equipment: Ultrasonic or oil analysis detect problems earlier
- Variable-speed and intermittent machines: Require additional consideration when selecting sensors; electrical signature analysis and thermal monitoring adapt better than vibration analysis
Consider Access and Inspection Frequency
Choose your deployment model based on asset criticality and site constraints:
| Approach | Best For | Example Technologies |
|---|---|---|
| Permanent online sensors | Critical assets that cannot go offline | Fixed thermal cameras, vibration transmitters, inline oil sensors |
| Periodic portable techniques | Lower-criticality assets or constrained environments | Route-based ultrasonic detectors, portable vibration analyzers |
| Non-contact scanning | Wide-area electrical and mechanical inspection | Thermal cameras covering full panels and switchgear in seconds |
Non-contact thermal imaging is particularly efficient: a single camera sweep covers an entire electrical panel in seconds, compared to physical probe placement at each individual point with contact methods.
Factor in Expertise and Integration Requirements
Some techniques require trained specialists to interpret data:
- Vibration spectral analysis — requires analyst certification and experience identifying fault frequencies
- Motor circuit analysis (MCA) — requires understanding of impedance, inductance, and phase unbalance
- Ultrasonic structure-borne analysis — requires skill distinguishing lubrication issues from early bearing fatigue
Other techniques can be monitored by generalist technicians with the right platform:
- **Thermal imaging with automated alert software** — cloud-based systems like MoviTHERM's iTL solution flag anomalies automatically with threshold alerts and trend visualization
- Pressure and temperature sensors — simple threshold-based alarming requires minimal interpretation
- Oil condition sensors — inline monitors provide straightforward fluid health indicators
Factor in team capability and software integration when choosing. If your team lacks the training to interpret complex spectral or waveform data, start with techniques that offer automated alerting and build expertise from there.
Use Multiple Techniques for Complete Coverage
Most mature condition monitoring programs combine techniques because each occupies a different position on the P-F curve (Potential Failure to Functional Failure interval) and detects different physical phenomena:
- Ultrasound detects friction and lubrication defects earliest (Stage 1-2)
- Vibration analysis excels at mechanical faults once wear progresses (Stage 3+)
- Oil analysis detects contamination and chemical degradation
- Thermography captures thermal anomalies across wide areas
- Electrical monitoring detects winding and power supply faults invisible to mechanical sensors
Pairing thermal imaging for electrical and thermal fault detection with vibration monitoring for rotating equipment covers a wider failure spectrum than either technique alone.
What to Check Before Finalizing Your Condition Monitoring Approach
Avoid selecting the most advanced or complex technique when a simpler one would reliably detect the target failure mode. Complexity adds cost, installation time, and training requirements without improving detection outcomes.
Before committing to a solution, run through these key considerations:
- Total cost of ownership: Factor in sensor installation, calibration, data management software, and the expertise required to interpret outputs. A low-cost sensor that generates noisy alerts may cost more in practice than a capable integrated system.
- Full system scope: A fixed thermal monitoring deployment, for example, includes the camera, IP67/IP69K-rated enclosure, I/O modules, cloud platform, and plant control integration. Understanding the full scope prevents budget surprises.
- Failure mode coverage: Defaulting to vibration monitoring for every asset misses electrical faults, lubrication problems detectable earlier by ultrasound, and internal wear visible only through oil analysis. Match the technique to the fault.
- Team actionability: The technique must produce outputs your team can reliably interpret and act on — not just data that sits in a dashboard.
The goal is the right technique on the right asset, configured to catch the right faults. Get that match correct, and long-term maintenance costs drop significantly.
Frequently Asked Questions
What is the difference between PdM and CBM?
Condition-Based Maintenance (CBM) triggers maintenance actions based on actual equipment condition data, while Predictive Maintenance (PdM) uses that data combined with algorithms or trend analysis to forecast when a failure will occur. In practice, PdM tells you when to act — CBM tells you that you need to act.
What does condition-based maintenance monitoring look for?
CBM monitoring looks for deviations from established baseline parameters that signal early-stage equipment degradation. These include changes in vibration amplitude, temperature rise, acoustic emission patterns, lubricant contamination, and electrical imbalances.
What are condition monitoring tools?
Condition monitoring tools are the sensors, instruments, and software used to measure and track equipment health parameters: accelerometers, thermal cameras, ultrasonic detectors, oil analysis equipment, and the data platforms that collect, visualize, and alert on this information.
What are the three types of equipment monitoring?
The three common categories are:
- Continuous (online) — permanently installed sensors providing real-time data
- Periodic (route-based) — portable instruments deployed on a scheduled rounds basis
- Inspection-based — non-contact or NDT techniques applied at planned intervals
What are the 5 elements of condition monitoring?
The five core elements are:
- Data collection — sensors measuring physical parameters
- Data transmission — routing data to a central system
- Data analysis — identifying deviations from baseline
- Alert and notification — triggering maintenance action when thresholds are crossed
- Feedback and trending — tracking changes over time to sharpen future predictions