Introduction
Most industrial equipment doesn't announce its failure with fanfare—it fails gradually, and heat is almost always the earliest signal. A loose electrical connection begins to develop excess resistance months before it arcs. A bearing starts generating friction heat weeks before it seizes. A battery cell begins thermal runaway minutes before catastrophic failure. The thermal signature shifts long before anything visibly goes wrong.
The cost of missing these signals is measurable. Predictive maintenance programs reduce maintenance costs by 25-30%, eliminate 70-75% of breakdowns, and cut downtime by 35-45% compared to reactive approaches. That's the difference between a scheduled $5,000 repair and an unplanned $150,000 failure — caught early, or not caught at all.
Infrared thermography (IRT) allows maintenance and reliability teams to see these thermal warning signs non-invasively—while equipment is running—and take corrective action before minor issues become major failures. This guide covers everything needed to understand, implement, and optimize an IRT-based condition monitoring program.
Key Takeaways
- IRT detects heat anomalies in industrial equipment without contact or shutdowns
- Identifies electrical, mechanical, and process faults early by converting infrared radiation into actionable thermal images
- Works across manufacturing, energy, aerospace, and battery production—up to 10x faster coverage than ultrasound
- A mature IRT program needs thermal baselines, severity thresholds, standards-based ΔT criteria, and CMMS integration
- MoviTHERM supplies complete IRT systems including cameras, enclosures, and iTL cloud monitoring, backed by 25+ years of industrial deployment experience
What Is Infrared Thermography for Condition Monitoring?
Infrared thermography in an industrial context is a non-contact, non-destructive inspection technique that measures surface temperatures by detecting the infrared radiation emitted by objects above absolute zero. Every piece of industrial equipment has a "thermal signature": a characteristic temperature pattern under normal operating conditions. Any deviation from that signature is an early indicator of a developing fault.
IRT sits within the predictive maintenance domain of condition monitoring, detecting degradation early enough to schedule corrective action before a fault becomes a failure. This timing maps to the P-F curve concept (potential failure to functional failure), where the P-F interval represents the window of opportunity for intervention.
ISO 13379-1 establishes the diagnostic framework aligned with these P-F intervals, positioning IRT as one of the most practical tools for catching faults within that interval.
At a glance, IRT offers condition monitoring teams:
- Non-contact measurement with no process interruption
- Detection of thermal anomalies before they escalate to failure
- Compatibility with live electrical and mechanical systems in operation
- Fast coverage — inspections run 8–10x faster than ultrasound methods
How well IRT performs in a given application depends largely on which approach you use. Industrial thermography relies on two fundamentally different methods:
Active vs. Passive Thermography
Active thermography requires an external heat source to stimulate the material. ASTM E2582-21 covers infrared flash thermography, a common active method that applies an external heat pulse to detect sub-surface defects in composites or structures. Engineers use this approach primarily for non-destructive testing of materials and composites.
Passive thermography uses the heat generated by the equipment itself as the thermal source. ISO 10878:2013 recognizes passive thermography as imaging based on emitted thermal radiation without external stimulation. This is the dominant approach for condition monitoring of live electrical and mechanical systems in operation, where the equipment's own heat signatures reveal operational health.
Why Infrared Thermography Is Critical for Industrial Operations
Thermal anomalies are either the cause or the symptom of the most common industrial failure modes: electrical resistance, mechanical friction, insulation breakdown, lubrication failure, and cooling system faults. IRT catches all of these through a single, non-intrusive scan of operating equipment.
Take a failing motor bearing: friction increases, heat rises, and the thermal signature appears long before performance drops. IRT detects these patterns early — before equipment degrades or safety is compromised.
The practical advantages make IRT the preferred condition monitoring technique in high-stakes industrial environments:
- Non-contact operation: No production shutdown, no gels or couplants required
- Safe to operate: No ionizing radiation, minimal operator training
- Wide coverage: Scan dozens of assets in a single thermal image
- Inspection speed: Cover large areas in a fraction of the time required by point-by-point methods
Predictive maintenance delivers ROI of approximately 10x, with predictive approaches yielding 8-12% additional savings over preventive maintenance alone. Organizations that adopt predictive maintenance strategies report a 20-25% production increase alongside significant reductions in unplanned downtime.
That ROI potential extends across virtually every asset class. IRT serves electrical infrastructure, rotating machinery, process equipment, solar PV, and structural assets — covering utility substation transformers, manufacturing line motors, and EV battery packs with the same non-contact scan. Few condition monitoring methods match that range.
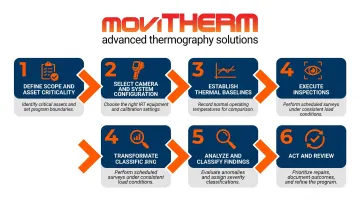
How to Implement an Infrared Thermography Condition Monitoring Program
A well-structured IRT program follows a repeatable process. Most program failures trace back to the same root causes: skipped setup steps (no baselines, inconsistent scan conditions) or findings that never reach corrective action.
Step 1: Define Scope and Asset Criticality
Identify which assets to prioritize using a criticality ranking based on failure impact, replacement cost, and operational role. Common starting candidates include:
- Electrical switchgear and panels
- Motors and bearings
- Transformers
- Heat exchangers
- High-load process equipment
Focus first on assets where failure would cause safety incidents, significant production loss, or major capital expense. A structured criticality matrix ensures inspection resources are deployed where they deliver maximum value.
Step 2: Select the Right Camera and System Configuration
Match thermal camera specifications to the inspection environment. Not all cameras are appropriate for all applications—outdoor substations, high-speed machinery, and small electronics have different requirements. Key specifications to evaluate include:
- Spectral range: Typically 7.5-14 μm (longwave infrared) for most industrial applications
- Spatial resolution: Higher pixel counts enable detection of smaller defects at greater distances
- Thermal sensitivity (NETD): Lower values (< 50 mK) detect smaller temperature differences
- Temperature range: Must cover the expected temperature range of your assets
- Frame rate: Higher rates (60+ Hz) needed for high-speed machinery or dynamic processes
MoviTHERM's vendor-neutral position—working with FLIR, Optris, and Seek—allows engineering teams to get the right camera for their specific application rather than a one-size-fits-all solution. Whether you need a ruggedized fixed camera for 24/7 outdoor substation monitoring or a high-speed system for battery cell inspection, the right hardware match is critical.
Step 3: Establish Thermal Baselines
Capture baseline thermograms of each asset under known, documented operating conditions—load level, ambient temperature, equipment age. These become the reference for all future scans; without them, individual readings lack the context needed to judge whether a temperature reading is normal or abnormal.
Document operating conditions during baseline capture:
- Electrical load (% of rated capacity)
- Ambient temperature
- Time of day
- Recent maintenance or modifications
- Known operational anomalies
Store baseline images and metadata in a centralized library indexed by asset ID. This thermal history becomes increasingly valuable as the program matures.
Step 4: Execute Inspections Under Consistent Conditions
Conduct scans at consistent conditions to enable meaningful comparison:
- Load levels: Industry standards typically recommend ≥40% load; higher loads (closer to normal operating conditions) provide more meaningful thermal data
- Ambient conditions: Temperature, humidity, and wind all affect readings
- Camera distance and angle: Maintain consistent positioning between inspections
- Emissivity settings: Adjust for surface materials (especially critical for metallic surfaces)
Common mistakes include scanning under-loaded equipment, ignoring reflected thermal radiation, and varying camera distance between inspections. ISO 18434-1 establishes general thermography procedures for machine condition monitoring, emphasizing the importance of consistent methodology.
Step 5: Analyze and Classify Findings
Apply severity criteria to classify each anomaly. Use absolute temperature thresholds or ΔT (temperature differential) relative to comparable components or ambient conditions. Document findings with:
- Thermal images showing the anomaly
- Visible-light reference images for context
- Location data and asset identification
- Measured temperature or ΔT value
- Severity classification per standard criteria
- Recommended action and timeframe
Each documented finding should map to a specific recommended action and target timeframe before leaving this step.
Step 6: Act and Review
Route findings to a CMMS or work order system for corrective action scheduling. After repair, conduct a follow-up scan to confirm temperature has returned to baseline. Use results to refine inspection frequency and identify systemic issues requiring design or process changes.
Closing the loop means reviewing trends across inspection cycles, not just individual findings. Track metrics such as:
- Recurring anomaly types by asset category
- Repair effectiveness (confirmed by follow-up scans)
- Whether inspection frequency matches observed degradation rates
Over time, this data shifts IRT from reactive detection into a program that predicts failures before they affect production.
Interpreting Thermal Data: Severity Criteria, Standards, and Best Practices
Evaluating thermal findings requires comparing measured temperatures against established criteria. Two primary methods are used:
Relative temperature criteria (ΔT): Compare the suspect component's temperature to a comparable reference component under identical conditions. This method is more common in electrical thermography because it reduces the impact of emissivity variation and ambient conditions.
Absolute temperature criteria: Compare measured temperature to maximum allowable values based on material specifications or design limits. This approach is used when manufacturer limits are known or when no comparable reference exists.
Severity Classification Frameworks
Widely adopted standards provide severity classification tiers based on ΔT thresholds:
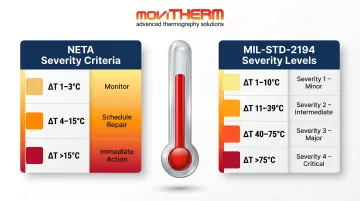
NETA (InterNational Electrical Testing Association): ANSI/NETA MTS severity criteria classify electrical equipment findings into action tiers. While the official tables are paywalled, industry training materials reproduce the framework:
| ΔT Range (Comparable Component) | Severity | Recommended Action |
|---|---|---|
| 1-3°C | Possible deficiency | Monitor and note for follow-up |
| 4-15°C | Probable deficiency | Schedule repair during next outage |
| >15°C | Major discrepancy | Repair immediately or take offline |
MIL-STD-2194: Military standard for infrared thermal imaging survey of electrical equipment classifies severity by ΔT above reference:
| ΔT Range | Severity Level | Priority |
|---|---|---|
| 1-10°C | Severity 1 | Minor - monitor |
| 11-39°C | Severity 2 | Intermediate - schedule repair |
| 40-75°C | Severity 3 | Major - repair soon |
| >75°C | Severity 4 | Critical - immediate action |
These frameworks provide consistent, defensible criteria for prioritizing corrective actions and communicating urgency across maintenance teams.
Variables That Affect Thermal Measurements
Those severity thresholds only hold up when the underlying measurements are accurate. Key variables that distort thermal data if left uncontrolled:
Emissivity: FLIR notes that highly polished metals have emissivity below 0.10, while oxidized surfaces can exceed 0.6. Incorrect emissivity settings alone can cause temperature errors of 50% or more.
Camera distance and angle: Infrared energy attenuates with distance and is affected by viewing angle relative to the target surface.
Ambient temperature: Affects the baseline temperature of all equipment and influences heat dissipation rates.
Wind and air movement: Increases convective cooling, lowering measured surface temperatures and potentially masking thermal anomalies.
Reflected radiation: Hot objects near the target can reflect their thermal signature onto it, creating false readings.
Document and control all five variables on every inspection — without this discipline, even the best severity framework loses its reliability.
Temperature Trend Analysis
A single reading may fall within normal ranges yet still signal a developing problem if it shows a consistent upward trend. Temperature trend analysis is the most effective way to get sustained insight from IRT data over time.
Plot monthly or quarterly readings per asset to reveal:
- Seasonal baselines and expected thermal variations
- Unexpected deviations from historical norms
- The effect of corrective maintenance on thermal signatures
- Gradual degradation not visible in single snapshots
This predictive view lets maintenance teams schedule repairs on their terms — before threshold breaches force the decision.
Best Practices for a Mature Thermographic Program
Build a comprehensive thermal library:
- Standard report template: Ensure every inspection follows the same documentation format
- Thermal history per asset: Maintain a chronological record of all scans for critical equipment
- Alert thresholds: Set thresholds that trigger reinspection rather than relying solely on fixed schedules
- Multi-technology correlation: Cross-reference thermographic findings with vibration and oil analysis data
When thermal data is layered with vibration and oil analysis, teams catch failures earlier and avoid false alarms — producing maintenance decisions grounded in evidence, not assumptions.
Key Industry Applications of Infrared Thermography Condition Monitoring
Electrical Systems and Power Infrastructure
IRT is the standard inspection method for electrical panels, switchgear, busbars, transformers, cable accessories, and power distribution equipment. Loose connections, unbalanced phase loads, failing fuses, and degraded insulation all produce distinct thermal signatures.
NFPA data on home structure fires (2015-2019) shows 32,620 fires per year from electrical distribution and lighting equipment, with arcing as the heat source in 73% of incidents. Industrial systems carry higher fault energy—meaning thermal anomalies that go undetected longer cause proportionally greater damage and arc flash risk.
Regular thermographic inspection of electrical infrastructure prevents fires, reduces arc flash risk, and extends equipment life by catching issues before they escalate.
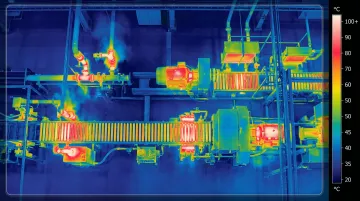
Rotating Machinery and Motors
IRT detects bearing wear, cooling system failure, stator winding asymmetry, misalignment, and over-lubrication—often well before vibration analysis can confirm a fault. Thermal images of motor housings and bearing caps provide non-intrusive condition snapshots during operation.
When bearings begin to fail, friction increases before mechanical vibration becomes measurable. IRT catches this thermal symptom in the earliest stages. Similarly, motor winding imbalances create localized hot spots visible in thermal scans before electrical performance degrades noticeably.
Combining IRT with vibration analysis provides complementary insights: IRT detects thermal symptoms (friction, electrical imbalance), while vibration detects mechanical faults (imbalance, misalignment, looseness). ISO 18434-1 establishes thermography procedures specifically for machine condition monitoring, recognizing its role alongside other diagnostic techniques.
Manufacturing Process Equipment and Quality Assurance
Fixed thermal cameras mounted over production lines detect thermal irregularities in real time—from uneven heating in curing ovens to weld integrity and composite delamination. This application shifts IRT from periodic inspection to continuous 24/7 monitoring.
Across industries, continuous thermal monitoring catches process variations the moment they occur:
- Battery manufacturing: Confirms uniform heating during cell formation and flags pack assembly anomalies before they become defects
- Food processing: Verifies consistent cooking and pasteurization temperatures across every batch
- Automotive assembly: Validates weld quality inline without interrupting production throughput
Renewable Energy and Battery Systems
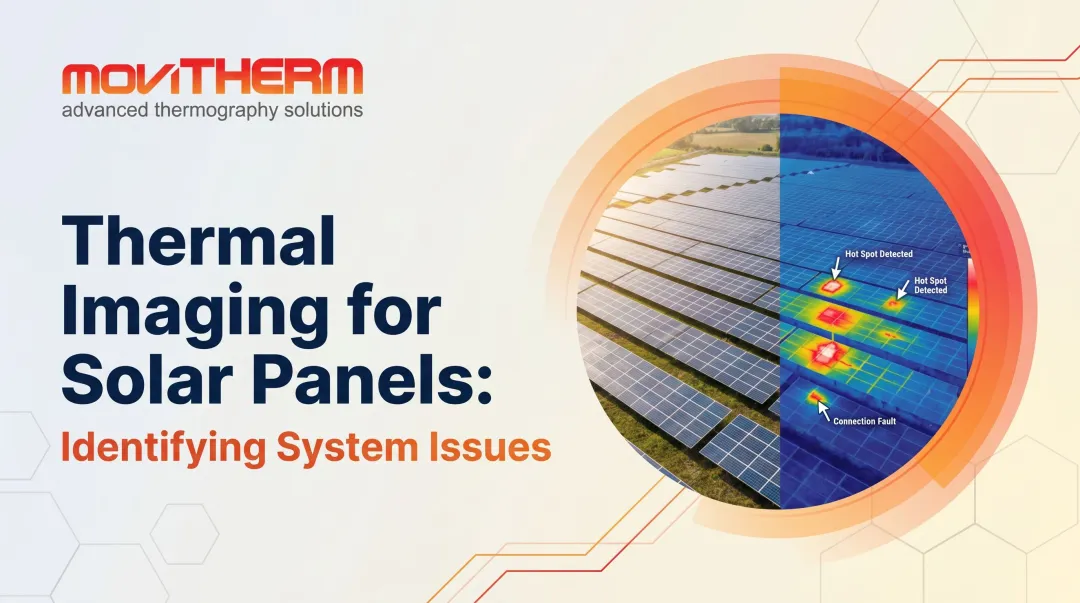
IRT is critical for solar PV inspection, battery pack monitoring, and wind turbine blade inspection.
Solar PV: IEA-PVPS Task 13 data (2014) shows that burn marks (hotspot-related) accounted for approximately 10% of total failures in field modules around 8 years old, with Hot-Spot Endurance Test failures representing roughly 9% of all failed certification tests. IEC TS 62446-3:2017 establishes standards for outdoor infrared thermography of PV modules, making IRT the accepted method for detecting hotspots, bypass diode failures, and cell-level defects.
Battery systems: Sandia National Laboratories' abuse testing manual details thermal runaway detection thresholds in Li-ion cells. Exotherm detection begins at ~0.02°C/min in controlled tests, with self-heating defined as dT/dt > 0.1°C/min. Real-world battery monitoring requires continuous thermal surveillance to catch cell-level anomalies before runaway propagates through the pack.
Wind turbines: IRT detects blade delamination, structural fatigue, and gearbox overheating—subsurface defects that visual inspection cannot reach without disassembly or shutdown.
Aerospace, Defense, and High-Reliability Environments
In sectors where failure is not an option, IRT is used for composite structure inspection, electronics thermal testing, and structural health monitoring of airframe components.
NASA's Non-Destructive Evaluation resources document extensive use of IR thermography, including post-Columbia inspection of Reinforced Carbon-Carbon (RCC) wing-leading-edge panels, on-orbit EVA tools, and additive manufacturing process monitoring. MoviTHERM's customers in this sector—including Lockheed Martin, Raytheon, SpaceX, and Collins Aerospace—rely on advanced thermographic systems for mission-critical applications where thermal anomalies can mean the difference between success and catastrophic failure.
How MoviTHERM Can Help
MoviTHERM is a thermal imaging integrator with over 25 years of exclusive focus on industrial monitoring. Every deployment is handled at the system level: camera selection, mounting and coverage design, network integration, alarming, and software configuration.
Unlike single-manufacturer distributors, MoviTHERM works with FLIR, Optris, and Seek to match the best hardware to each application. Whether you need a ruggedized fixed camera for outdoor substation monitoring, a high-speed system for battery inspection, or a compact unit for electronics quality control, MoviTHERM recommends the right camera for the job—not just the one they happen to carry.
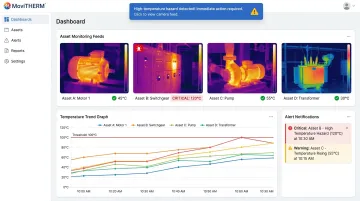
iTL Cloud Monitoring Platform
The iTL cloud monitoring platform is MoviTHERM's proprietary solution for 24/7 continuous thermal surveillance. iTL delivers:
- Real-time alerts via text, voice, and email when temperature thresholds are exceeded
- Cloud-based image storage and trend data accessible from anywhere
- Automated monitoring that eliminates reliance on periodic manual inspections for critical assets
iTL bridges the gap from periodic IRT programs to continuous condition monitoring. Instead of quarterly or monthly scans that might miss rapidly developing faults, iTL provides constant visibility into thermal health with immediate notification when anomalies appear.
Trusted by Industry Leaders
MoviTHERM is trusted by global leaders including Tesla, Amazon, SpaceX, Apple, Intel, Lockheed Martin, and Collins Aerospace—organizations where thermal monitoring directly affects safety, yield, and uptime. That client roster reflects consistent delivery: systems that integrate cleanly, alert reliably, and hold up in demanding production environments.
To discuss a condition monitoring system for your facility, call (949) 699-6600 or email info@movitherm.com.
Frequently Asked Questions
What is infrared thermography for condition monitoring?
Infrared thermography for condition monitoring is a non-contact inspection technique that captures the thermal signatures of industrial equipment to detect heat anomalies early. This allows maintenance teams to identify developing faults—such as electrical resistance, mechanical friction, or insulation breakdown—before they cause unplanned failures or safety incidents.
What are the key elements of condition monitoring?
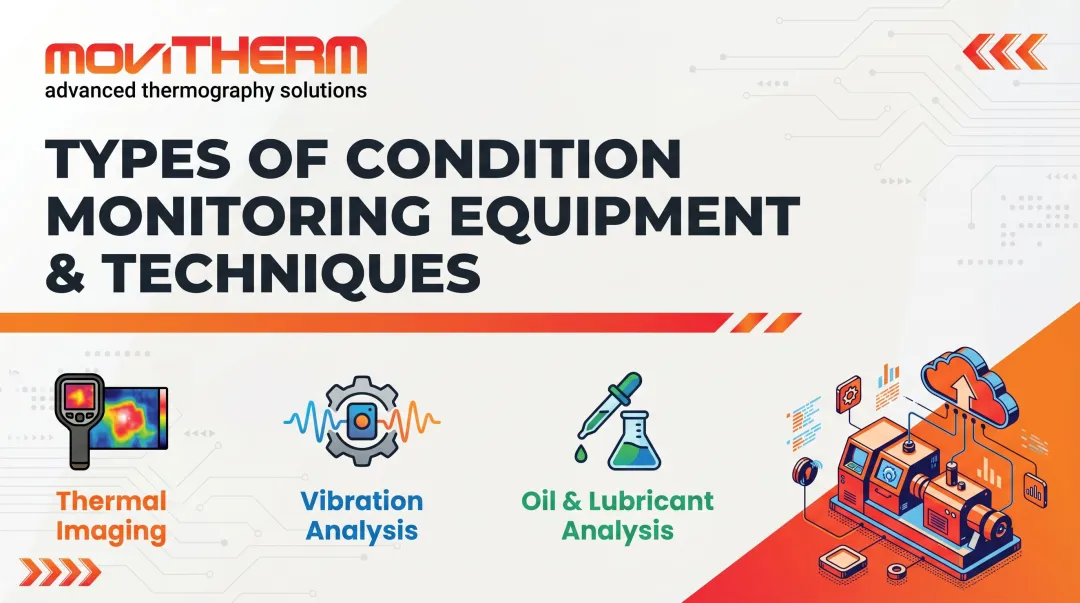
Four core pillars define an effective condition monitoring program:
- Establish baselines for normal equipment behavior
- Detect deviations using sensing technologies such as IRT, vibration analysis, and ultrasound
- Apply severity criteria to classify findings by urgency
- Route findings to maintenance work orders in a closed-loop process that confirms corrective action
How does infrared thermography differ from vibration analysis or ultrasound?
IRT detects thermal anomalies visually and without contact, covering large areas in a single pass—making it especially effective for electrical systems and broad asset sweeps. Vibration analysis targets imbalance and bearing faults, while ultrasound identifies leaks and electrical discharge. All three techniques complement each other in a complete condition monitoring program.
What is the difference between active and passive thermography?
Passive thermography uses the heat generated by the equipment itself (ideal for in-service electrical and mechanical condition monitoring), while active thermography applies an external heat stimulus to reveal sub-surface defects. Active methods like flash thermography per ASTM E2582-21 are used more commonly in NDT applications such as composite inspection.
What industries benefit most from infrared thermography condition monitoring?
IRT delivers the highest ROI in manufacturing, utilities, renewable energy, battery production, aerospace and defense, and oil and gas. These sectors combine high-value assets, continuous operations, and low tolerance for unplanned downtime—conditions where early fault detection directly protects both safety and revenue.
How often should infrared thermography inspections be conducted?
Inspection frequency depends on asset criticality and failure history. High-criticality electrical equipment is typically inspected quarterly or annually per NETA guidelines, while critical rotating equipment may warrant monthly scans. Fixed continuous monitoring systems like MoviTHERM's iTL platform eliminate the frequency question entirely by providing 24/7 data streams with real-time alerting when thermal thresholds are exceeded.