The problem is that these failures are invisible to the naked eye. A panel can look perfectly intact while a single cell string operates at temperatures high enough to cause permanent damage. According to IEA PVPS research, crystalline silicon modules degrade at a median rate of 0.5% per year — but defective modules degrade far faster, and without thermal monitoring, that accelerated loss goes undetected for months or years.
Thermal imaging has become the standard diagnostic tool for catching these issues early. This article covers what it detects, how inspections work step by step, how to read results accurately, and what conditions produce reliable data.
Key Takeaways
- Infrared cameras reveal heat patterns across solar panels that visual inspection misses entirely
- Detectable issues include hot spots, bypass diode failures, cracked cells, loose connections, soiling, and inverter faults
- Valid inspections per IEC TS 62446-3 require irradiance above 600 W/m² and wind speeds below 28 km/h
- Any ΔT above 10°C on a single panel signals a fault that needs immediate attention
- Fixed continuous monitoring catches faults in real time — not just during scheduled inspection windows
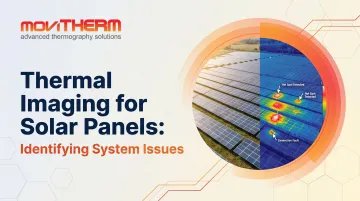
What Is Thermal Imaging for Solar Panels?
Infrared cameras detect heat radiation emitted by objects and convert it into thermograms — visual images where color gradients represent temperature differences across a surface. In a solar context, this means capturing the heat map of an entire panel array and comparing what you see against what a healthy system should look like.
Under normal operation, PV panels radiate heat relatively uniformly. Any defect — electrical, physical, or environmental — disrupts that uniformity and creates a detectable thermal anomaly. Common examples include:
- Cracked cells — increased electrical resistance generates localized heat
- Failed bypass diodes — cause a string of cells to overheat or drop out entirely
- Loose MC4 connectors — concentrate resistance at a single point, appearing as a bright hot zone in the thermogram
Two Inspection Modes
Solar thermal inspection takes two forms, each serving different operational needs:
- Periodic surveys — scheduled inspections conducted annually or after specific events (storms, hail), providing a point-in-time snapshot of system health
- Continuous fixed-camera monitoring — permanently mounted cameras running 24/7, integrated with alarm systems and cloud software, catching thermal anomalies the moment they develop rather than at the next scheduled visit
Both approaches rely on the same underlying infrared technology. The distinction is coverage frequency — and at utility scale, a defect missed between annual surveys can mean months of degraded output before anyone notices.
What Solar System Issues Can Thermal Imaging Detect?
A thermal inspection covers the entire solar system — not just panel surfaces. Combiner boxes, junction boxes, inverters, and disconnects all generate detectable thermal signatures when something is wrong. Skipping balance-of-system components during an inspection misses some of the most financially damaging and fire-prone fault types.
Hot Spots on Cells and Strings
Hot spots appear as bright warm zones in thermograms. Causes include cracked cells, manufacturing defects, partial shading, or elevated internal resistance. A single affected cell forces neighboring cells to dissipate extra power as heat rather than convert it to electricity.
A thermography study covering over 12 GW of solar PV plants — more than 30 million modules across five continents — found median hot spot prevalence of 1.4% of installed modules, with some plants reaching 30%. Estimated energy loss from hot spots ranges from 0.5% to 3% of total generation.
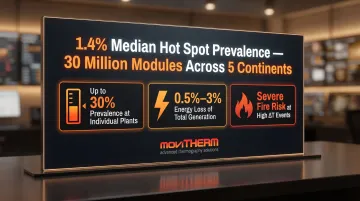
When ΔT is severe, hot spots present a genuine fire risk. They also cause permanent cell damage that compounds over time.
Bypass Diode Failures
Bypass diodes protect individual cell strings from damage during partial shading. When they fail, the thermal signature differs from a typical hot spot — the affected area spans an entire section of the panel rather than a single cell.
NREL failure analysis found junction temperatures of 132–151°C in failed bypass diodes, with evidence of solder reflow indicating internal temperatures exceeding 188°C. Each failed diode reduces module open-circuit voltage by approximately 33%.Field data shows diode failure rates reaching 11–25% per year in certain climates — at that scale, a single uninspected string can silently shed a third of its voltage output for months before anyone notices.
Electrical Connection Faults
Loose terminals, corroded MC4 connectors, and improperly torqued wiring in combiner boxes generate localized heat at the connection point. These are easy to overlook visually but appear clearly in a thermogram.
NREL, Sandia, and EPRI joint analysis of a 100 MW plant found connector failures account for $3.9 million in lost production over 30 years and a 3.3% increase in LCOE. DC connectors and combiner boxes together account for 42% of PV-system-caused fires — making thermal inspection of these components a safety requirement, not just a maintenance optimization.
Inverter and Environmental Anomalies
Beyond electrical faults, thermal imaging flags performance anomalies that visual inspection misses entirely:
- Inverter overheating — failed cooling fans or blocked ventilation show as hot zones around the housing; scanning adjacent inverters simultaneously makes outliers immediately apparent
- Soiling — heavy dirt or bird droppings appear as cooler zones due to reduced irradiance absorption
- Delamination — layer separation inside a panel produces irregular temperature distribution as air gaps disrupt heat transfer
How to Conduct a Solar Panel Thermal Inspection — Step by Step
A thermal inspection follows a structured sequence — and the setup steps aren't optional. Skipping condition checks undermines the reliability of every result that follows.
Step 1 — Verify Conditions Before Starting
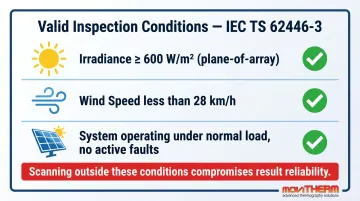
Per IEC TS 62446-3, valid inspection conditions require:
- Irradiance: ≥600 W/m² (plane-of-array)
- Wind speed: <28 km/h
- System status: Operating under normal load with no active fault conditions
Scanning in insufficient irradiance produces weak thermal differentials that make anomalies difficult to distinguish from normal variation. Avoid periods with passing clouds or recent rain.
Step 2 — Select and Configure the Right Camera
IEC TS 62446-3 requires each individual PV cell to be covered by a minimum of 5×5 pixels. The key specification is IFOV (Instantaneous Field of View): the smaller the value, the more detail captured at a given distance.
Camera selection depends on working distance. Ground-based inspections at close range have different resolution requirements than fixed-mount cameras covering large arrays from elevation. MoviTHERM helps solar operators identify the right camera — FLIR A-series, Optris PI/Xi, or others — for their specific installation geometry and configure it to meet IEC requirements before the first scan.
Set emissivity to 0.85–0.90 for clean glass panel surfaces, consistent with peer-reviewed measurements confirming PV cover glass emissivity averages approximately 90%.
Step 3 — Scan Panels and Record Thermograms
- Capture images at 45°–85° relative to panel surface to avoid specular reflection
- Take multiple images of suspected anomalies from different angles
- Record irradiance values at the time of each scan — this data is required for accurate severity calculations
Step 4 — Inspect Balance-of-System Components
Scan combiner boxes, disconnects, and inverters separately:
- Combiner boxes — hot strings indicate high-resistance connections; cold strings point to dead or disconnected circuits
- Inverters — scan adjacent units comparatively to identify temperature outliers that indicate performance degradation
Step 5 — Document Findings with Location Data
Map every anomaly to its string number, panel position, and component type. Record:
- ΔT values (anomaly temperature vs. surrounding reference area)
- Irradiance at time of scan
- Visual observations
This documentation establishes the baseline for trend analysis across future inspections.
Step 6 — Determine Next Actions Based on Severity
| Component | ΔT Threshold | Action |
|---|---|---|
| PV panels | <5°C | Monitor at next inspection |
| PV panels | 5–10°C | Investigate and schedule repair |
| PV panels | >10°C | Immediate action required |
| Combiner box connections | >2°C | Address promptly |
| Any component | Burn marks visible | Shut down affected string immediately |
How to Interpret Thermal Imaging Results
Not every thermal anomaly represents a real defect. Separating genuine faults from false positives requires trained interpretation — acting on false positives wastes maintenance resources while the issues that actually matter go unaddressed.
Common False Positives
- Bird droppings, tree sap, and surface dust create temporary cool or warm zones unrelated to component failure
- Shadows from nearby structures or adjacent panel rows produce transient thermal patterns
- Passing clouds introduce rapid temperature changes that can mimic electrical faults
- Recent rain temporarily suppresses soiling signatures
Any anomaly identified under suspect conditions should be re-scanned under stable, clear-sky conditions before taking corrective action.
Using ΔT as the Primary Metric
Once false positives are ruled out, ΔT becomes your primary diagnostic tool. Compare the suspect area's temperature to adjacent cells operating under the same irradiance and load conditions — the thresholds follow IEC TS 62446-3 classification. Avoid comparing readings from scans taken at different irradiance levels; the numbers won't be directly comparable.
Reading Anomaly Patterns
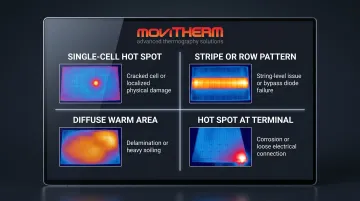
The shape of a thermal anomaly often identifies its root cause:
- Single-cell hot spot → cracked cell or localized physical damage
- Stripe or row pattern → string-level issue or bypass diode failure
- Diffuse warm area across a panel → delamination or heavy soiling
- Hot spot at a connection terminal → electrical resistance from corrosion or loose fit
Confirming Findings
After identifying an anomaly, verify through electrical testing — voltage and current checks at the combiner box — and visual inspection. After any corrective action, re-scan to confirm the thermal signature has resolved. A persistent anomaly after repair indicates the root cause wasn't fully addressed.
Best Practices for Accurate Solar Thermal Inspections
Follow these four practices to get consistent, defensible results from every solar thermal inspection:
1. Establish an inspection cadence. Annual thermal inspections during the first three years of operation are widely recommended for commercial and utility-scale arrays. New installations should be scanned within the first six months to catch installation defects while still under warranty. Coastal, desert, and high-temperature environments typically warrant more frequent scanning.
2. Control emissivity and reflection. Set camera emissivity to 0.85–0.90 for glass panel surfaces. Keep direct solar reflection out of the frame — glare introduces measurement errors that can mask or mimic defects. Conduct scans during peak solar hours when thermal differentials between healthy and defective cells are most pronounced.
3. Build a baseline. Conduct a full thermal inspection at commissioning and store those thermograms. All subsequent inspections should compare against this baseline. Gradual degradation trends often won't trigger immediate ΔT thresholds but are visible when benchmarked against commissioning data — allowing you to catch output losses before they compound.
4. Document for insurance and warranty compliance. Many insurers mandate annual thermal inspections for commercial and utility-scale projects. Thorough records — including ΔT values, irradiance data, and anomaly location mapping — directly support warranty claims and insurance reporting requirements.
How MoviTHERM Can Help
MoviTHERM has specialized exclusively in thermal imaging for industrial and energy applications for over 25 years. As an authorized FLIR Premium Partner and distributor of Optris and Seek cameras, MoviTHERM provides complete inspection systems — not just cameras.
For solar operators, that means help selecting the right camera for a specific installation's geometry, configuring it to meet IEC TS 62446-3 requirements, and integrating it into an existing O&M workflow. The goal is getting actionable data from day one rather than spending time on camera selection, mounting design, and alarm configuration independently.
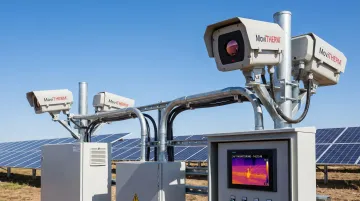
For utility-scale solar farms and large commercial installations, MoviTHERM's iTL (Intelligent Thermal Locator) platform closes the monitoring gaps that periodic inspections leave open. The system runs 24/7 thermal surveillance with automated alerts via text, voice, and email — catching anomalies as they develop rather than weeks later.
The platform's MapVIEWS feature lets operators overlay cameras and sensors on facility schematics, so alarm locations are immediately identifiable without manual cross-referencing.
MoviTHERM also offers the Solar-Check system — a complete irNDT system using lock-in thermography for detailed solar cell inspection, capable of detecting cracks, shunts, and emission anomalies at micro-Kelvin sensitivity levels that standard periodic inspections cannot match.
Each deployment includes the full stack, reducing complexity for engineering teams managing large installations:
- Camera selection and mounting design for the specific array geometry
- Networking and alarm configuration out of the box
- Software integration with existing O&M workflows
- Ongoing technical support from specialists with domain expertise
Frequently Asked Questions
What is solar thermography?
Solar thermography uses infrared cameras to capture heat patterns across PV panels and system components, identifying temperature anomalies that indicate defects, electrical faults, or performance loss — without physical contact or system shutdown. Results are captured as thermograms showing temperature variation across the array.
What does a hot spot on a solar panel mean?
A hot spot is an area operating at a higher temperature than surrounding cells, typically caused by a cracked cell, shading, bypass diode failure, or localized electrical resistance. Severity depends on the ΔT compared to adjacent healthy cells — above 10°C requires immediate action, while 5–10°C warrants investigation.
What to look for when inspecting solar panels?
Thermally, look for elevated temperatures on individual cells, warm zones at connection terminals, and abnormal temperature patterns across combiner boxes and inverters. Visually, check for cracked glass, damaged frames, and visible soiling. Both types of observations should be recorded together for accurate diagnosis.
How much does a thermal imaging inspection cost?
Drone-based thermal inspection typically runs approximately $150–$500 per MW, varying by site complexity, location, and report depth. That cost is modest compared to the losses it prevents — connector failures alone can cost a 100 MW plant nearly $4 million in lost production over 30 years.
Is thermal imaging inspection worth it?
For any commercial or utility-scale solar installation, yes. Thermal inspections detect performance-reducing defects early, prevent equipment failures from escalating, and support warranty and insurance requirements. For high-value assets expected to operate for 25–30 years, catching faults early isn't optional — it's the difference between planned maintenance and unplanned revenue loss.