Introduction
EV battery replacement isn't cheap. Depending on pack size, out-of-pocket costs run between $5,000 and $20,000, and that's before labor or overhead. For fleet operators managing dozens or hundreds of vehicles, unchecked battery degradation translates directly into reduced range, unplanned downtime, and accelerated replacement cycles.
Most battery failures don't arrive without warning. Degradation leaves detectable signatures in voltage data, capacity curves, and thermal distribution patterns — often well before a cell fails or a pack drops below warranty thresholds.
This guide covers three primary monitoring methods, from onboard diagnostics to thermal imaging inspection, along with the tools required, how to interpret results, and the mistakes that consistently undermine accurate monitoring.
Key Takeaways
- State of Health (SoH) measures a battery's current capacity as a percentage of its original rated capacity — the core metric for tracking degradation
- EV battery monitoring uses three main methods: onboard BMS/telematics, OBD-II diagnostic scanning, and thermal imaging — each revealing different failure signals
- Readings map to three outcomes — normal operation, early degradation (adjust practices), or out-of-spec conditions requiring immediate action
- Thermal imaging catches what electrical diagnostics miss — hot spots, uneven cell heating, and early thermal runaway precursors invisible to voltage or SoH data
What You Need to Monitor EV Battery Health
The right monitoring approach depends on context. A consumer vehicle owner checking degradation annually needs different tools than a fleet depot running 200 commercial vans, or a battery manufacturing QC line inspecting cells before they ship.
Tools and Indicators Required
| Use Case | Core Tools |
|---|---|
| Consumer vehicle | Vehicle infotainment system, OBD-II scanner, diagnostic app |
| Commercial fleet depot | Fleet telematics platform, connected charging management software |
| Manufacturing / QC | Fixed thermal cameras, data logging software, cloud monitoring platform |
Across all contexts, the essential toolkit includes:
- Onboard BMS display or vehicle infotainment interface
- OBD-II diagnostic port and compatible EV scanner
- Third-party fleet telematics software (for multi-vehicle visibility)
- Thermal imaging camera for advanced inspections
Industrial deployments typically add data logging software and network connectivity for continuous cloud-based monitoring.
Preconditions and Setup
Accurate readings require the battery to be in a specific state at the time of measurement.
For capacity tests: Fully charge the battery to 100%, then discharge under controlled conditions. Measure total energy delivered and compare against the manufacturer's rated capacity.
For thermal imaging: The battery must be under active load — either charging or discharging. A resting battery produces minimal thermal gradient, making cell-level hot spots undetectable.
Environmental factors to account for:
- Ambient temperature extremes distort thermal baselines — record conditions before capturing any thermal data
- Ensure a stable, level surface for vehicle-level diagnostics to avoid sensor interference
- Establish baseline thermal images under consistent, controlled conditions before using thermal data for diagnosis
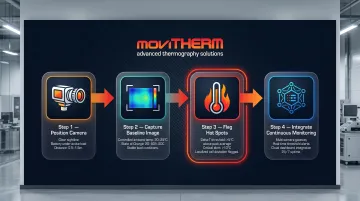
Methods to Monitor EV Battery Health
Three methods exist, each addressing different failure modes at different timescales. Using all three together provides the most complete picture.
Method 1: Onboard BMS and Telematics Monitoring
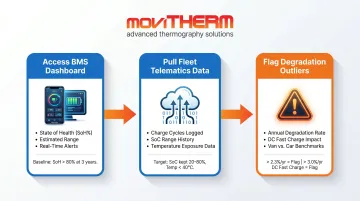
What it does: The Battery Management System continuously measures cell voltages, pack temperature, State of Charge (SoC), and charge cycle counts. Fleet telematics platforms aggregate this data across vehicles for trend analysis over time.
Tools needed: Vehicle infotainment system or companion app; for fleets, a connected charging management platform that syncs BMS data.
Step-by-step:
- Access the battery health menu via the vehicle's infotainment system or companion app. Record SoH percentage, estimated range, and any active system alerts.
- For fleets, pull aggregated telematics data covering charge cycle counts, average SoC operating ranges, and temperature exposure history across the fleet.
- Flag any vehicle degrading faster than 2.3% per year — Geotab's 2026 study of 22,700+ vehicles found this as the fleet average, with vehicles using frequent DC fast charging above 100 kW reaching 3.0% annually. Commercial vans average 2.7% per year versus 2.0% for passenger cars.
Limitations: Always active with no additional hardware required, but limited to what the BMS is designed to report. It cannot identify individual weak cells or detect early thermal anomalies at the cell level.
Method 2: OBD-II Diagnostic Scanning and Capacity Testing
What it does: An external OBD-II scanner accesses deeper battery data beyond dashboard displays — including individual cell voltages and internal resistance values. A deliberate full charge-discharge cycle provides a direct capacity measurement.
Tools needed: OBD-II scanner compatible with the EV model; diagnostic apps such as LeafSpy (Nissan Leaf) or TeslaFi (Tesla); EV-specific battery diagnostic software.
Step-by-step:
- Plug the OBD-II scanner into the vehicle's diagnostic port and launch the compatible app. Navigate to the battery module data to retrieve cell-level voltages, SoH estimate, and internal resistance readings.
- To perform a capacity test, charge the battery to 100%, then drive or discharge to near-empty under controlled conditions. Compare total energy delivered against the manufacturer's rated capacity.
- Document cell voltage deviations. Healthy packs maintain cell voltages within 10–20 mV of each other. Deviations of 50–100 mV or more indicate active imbalance requiring investigation.
A note on OBD-II and EVs: Standard OBD-II parameter IDs were designed for emissions monitoring. EVs aren't legally required to support standard OBD-II requests because they lack combustion engines — most use manufacturer-specific UDS communication protocols. Model-specific tools like LeafSpy or TeslaFi handle this by interpreting proprietary data directly.
Limitations: OBD-II scanning reveals granular cell-level data the BMS dashboard won't show, but requires manual setup, runs only on demand, and often needs model-specific software. BMS-reported SoH is a model-based estimate; a capacity test delivers a direct measurement. Treat them as complementary, not interchangeable.
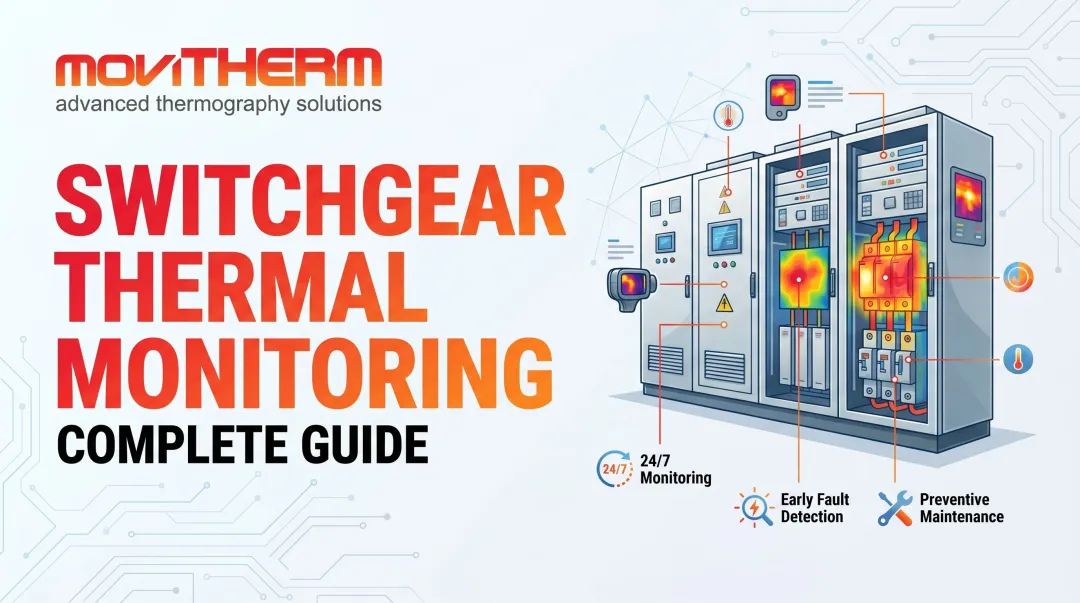
Method 3: Thermal Imaging Inspection
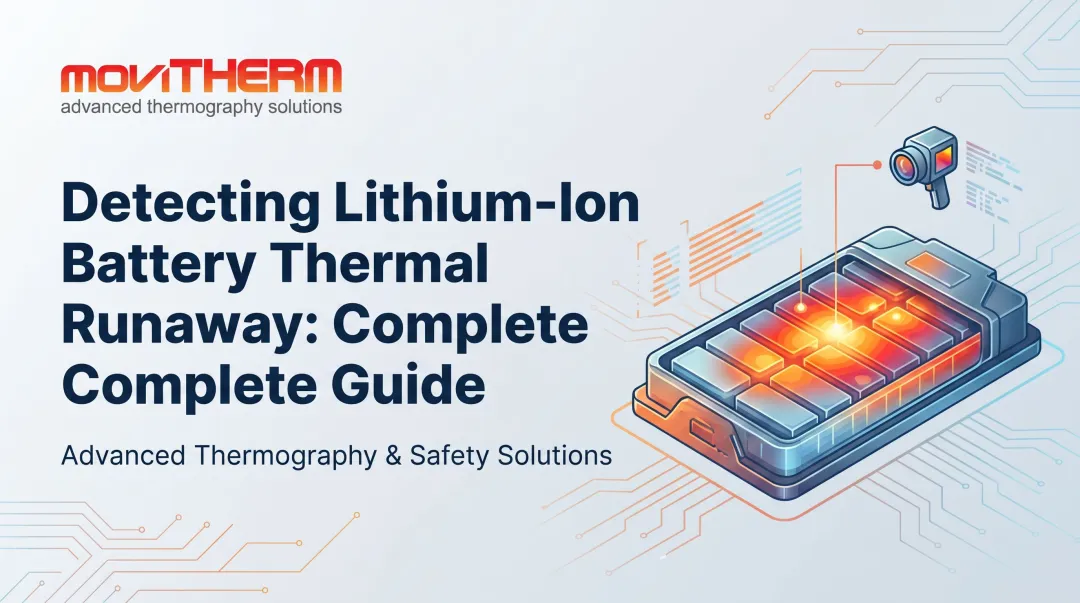
What it does: Infrared thermal cameras capture heat distribution across battery cells and modules during charging or discharge. Hot spots, temperature gradients between cells, and asymmetric heating patterns indicate internal resistance buildup, cell imbalance, or early thermal runaway precursors — conditions that electrical measurements alone cannot reliably detect.
Research published in iScience (2025) found that thermal imaging identifies progressive small faults that traditional voltage/current signal processing methods frequently miss. Early-stage faults exhibit temperature rise rates of just 0.1°C to 1°C per minute — detectable by thermal cameras before any electrical anomaly registers.
Tools needed: A calibrated infrared thermal camera such as FLIR A-Series or Optris PI/Xi Series cameras. For continuous 24/7 surveillance in a fleet depot or manufacturing environment, an integrated cloud monitoring platform like MoviTHERM's iTL system delivers threshold-based alerts via text, voice, and email, with immediate local alarm response upon threshold breach.
Step-by-step:
- Position the thermal camera with a clear, unobstructed sightline to the battery pack or module assembly. Confirm the battery is under active load to generate detectable thermal gradients.
- Capture a baseline thermal image under known-good conditions and store it as a reference. Compare all subsequent images against this baseline to identify emerging hot spots or changes in heat distribution.
- Flag any cells or modules showing temperature more than 5°C above the pack average. A cell-to-cell delta-T above 5°C (5 K) warrants immediate investigation; within individual cells, the acceptable differential is approximately 2°C.
- For fleet depot or manufacturing environments, integrate thermal cameras into a continuous monitoring network. MoviTHERM's iTL platform supports up to eight cameras per gateway, with configurable threshold alerts and automated notifications. The gateway triggers alarms locally — independently of cloud data update rates — ensuring immediate response.
Why chemistry matters for thermal monitoring: NMC-811 cells propagate thermal runaway roughly five times faster than LFP cells (5.96 Wh/min vs. 1.20 Wh/min). Internal reaction time for NMC is approximately 13 seconds versus 146 seconds for LFP — meaning the intervention window after runaway begins is nearly nonexistent. For NMC packs, catching thermal precursors early isn't a best practice; it's the only viable strategy.
Limitations: Non-contact, non-destructive, and faster than most alternative inspection techniques. The initial hardware investment and system integration require some planning, and accurate interpretation of thermal signatures requires some operator training. MoviTHERM provides on-site or virtual training with every system deployment.
How to Interpret EV Battery Monitoring Results
Misreading results carries real consequences in both directions. Missed early degradation leads to premature failure; overreacting to normal thermal variance causes unnecessary downtime. Here's what each result category means.
Normal Operation
- SoH above 80% with annual degradation at or below 2.3%
- Thermal images showing uniform temperature distribution within 15°C–35°C (the optimal operating range for lithium-ion cells)
- Internal resistance stable relative to the established baseline
- Cell voltage deviations within 10–20 mV
Next step: Continue current monitoring schedule and charging practices.
Early Degradation Signals
- SoH declining faster than expected for the vehicle type and duty cycle
- Cell voltage deviations increasing toward the 30–50 mV range
- Localized warm zones appearing on thermal images, still within safe limits
Next steps:
- Reduce DC fast charging frequency
- Keep SoC within the 20–80% range during daily operation
- Increase monitoring frequency
- Schedule a professional diagnostic before the next major service interval
Out-of-Spec — Requires Immediate Action
- SoH below 70–80% (the threshold that triggers warranty evaluation under the federal 8-year/100,000-mile EV battery coverage)
- Hot spots on thermal imaging indicating failing cells or thermal runaway risk
- Internal resistance values significantly above the established baseline
- Cell voltage deviations 50–100 mV or greater
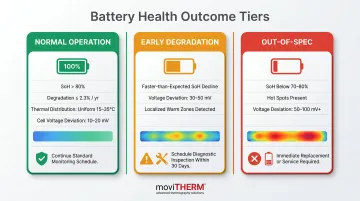
Next steps:
- Take the vehicle or battery module out of service immediately
- Isolate the affected module from the rest of the pack
- Arrange professional inspection or replacement before returning to operation
Common Errors in EV Battery Health Monitoring
Three mistakes consistently undermine monitoring accuracy:
Monitoring the battery at rest. Thermal imaging and capacity tests must be performed during charging or discharge. A resting battery produces minimal thermal gradient — cell-level hot spots and imbalances simply won't appear. Confirm the battery is active before capturing any data.
Comparing SoH readings across methods without accounting for their differences. BMS-reported SoH is a model-based estimate; a capacity test delivers a direct measurement. These will rarely match exactly. Treating that gap as a defect leads to unnecessary repairs. Use them as complementary data points, not competing figures.
Ignoring environmental variables when interpreting thermal images. Ambient temperature, airflow around the battery pack, and time elapsed since charging all influence the thermal signature captured. Record ambient conditions alongside every thermal data set. Build baselines under consistent, controlled conditions before using thermal images diagnostically.
Safety and Best Practices
EV battery packs operate at 400–800V or higher — voltages that demand strict safety discipline before any hands-on inspection. Follow these protocols every time:
- Follow LOTO procedures (OSHA 29 CFR 1910.147) before accessing high-voltage battery systems. EV packs operate at 400–800V+ and must be de-energized by qualified personnel prior to any direct contact.
- Use appropriate PPE — insulated gloves, eye protection, and arc flash protection (per NFPA 70E) when working near exposed battery modules or high-voltage connectors. For thermal imaging, maintain a safe standoff distance.
- Keep the inspection area free of conductive debris. Contamination near battery terminals can cause shorts that compromise both safety and diagnostic accuracy.
- Establish a regular monitoring schedule — at minimum, annual capacity tests and thermal inspections; monthly for high-cycle fleet applications, quarterly for lighter use.
- Document all results. Inspection records support warranty claims, track degradation trends over time, and enable proactive maintenance planning before failures occur.
Frequently Asked Questions
What is State of Health (SoH) and how is it calculated for an EV battery?
SoH represents the battery's current usable capacity as a percentage of its original rated capacity. The BMS calculates it by tracking energy input during charging and output during discharge using coulomb counting (SOH = C_max / C_rated). Note that BMS-reported SoH is a model-based estimate — direct capacity testing typically provides greater accuracy.
How does thermal imaging detect battery health issues that other methods miss?
Thermal imaging captures heat distribution across individual cells and modules during operation, revealing hot spots caused by increased internal resistance, cell imbalance, or early-stage thermal runaway. These faults often don't yet register in voltage or SoH data, making thermal inspection one of the few methods capable of catching them at the precursor stage.
What temperature range is considered normal for an EV battery pack during charging?
The optimal operating range for lithium-ion EV batteries is 15°C to 35°C. Charging below 0°C risks lithium plating; above 45°C accelerates electrolyte decomposition and SEI growth. Significant deviation from this range, or uneven temperature distribution between cells, indicates a potential health issue.
How often should EV battery health monitoring be performed?
Review BMS data continuously or at regular fleet reporting intervals, and run capacity tests at least annually. For thermal imaging, scale inspection frequency to use intensity — high-utilization fleet and manufacturing environments typically warrant monthly or more frequent checks.
Can EV battery health be monitored non-invasively without removing the battery pack?
Both telematics/BMS monitoring and thermal imaging are fully non-invasive and non-destructive. Thermal cameras require no physical contact, no couplants, and no disassembly — making them well-suited for in-service inspection of installed battery packs.
What is the difference between monitoring at the cell level versus the pack level?
Pack-level monitoring via BMS or telematics gives an aggregate picture of overall health. Cell-level monitoring — achievable through OBD-II diagnostic tools or thermal imaging — reveals which individual cells or modules are degrading faster, enabling targeted intervention before pack-level performance is affected.