Introduction
Transformers sit at the heart of every power grid, industrial plant, and utility network. When one fails unexpectedly, production halts, safety hazards emerge, and expensive emergency responses follow. Replacement lead times now average 120+ weeks, more than double what they were just four years ago.
A failed unit can sideline a facility for two years or longer.
The deeper issue is how most facilities still monitor their transformers: periodic inspections, manual oil sampling, or waiting for a relay to trip. By the time those methods catch a problem, the damage is already done.
This article covers how real-time transformer health monitoring systems work — the parameters they track, the sensing technologies involved (including thermal imaging), how system architecture is structured, and what engineering teams need to consider before and during implementation.
Key Takeaways
- Real-time monitoring uses sensors, IoT connectivity, and analytics to track transformer condition continuously
- Key parameters include temperature, load current, voltage, oil level, dissolved gas concentrations, vibration, and humidity
- Thermal imaging cameras detect surface hot spots on energized equipment without physical contact or shutdown
- A complete system connects data acquisition hardware through communication protocols (MQTT, Modbus) to cloud or edge analytics platforms
- Effective deployment requires sensor selection by criticality, baseline threshold calibration, and SCADA/CMMS integration planning
Why Traditional Transformer Monitoring Falls Short
Two legacy approaches dominate most facilities: periodic on-site inspections and SCADA-connected relay monitoring.
Periodic inspections are episodic by design. An inspector visiting quarterly or annually cannot detect a fault that develops in the weeks between visits. Relay-based SCADA monitoring catches gross electrical faults, but extending full SCADA integration to distribution transformers requires new cabling, additional engineering, and significant capital — costs that rarely pencil out for lower-voltage assets.
The real problem is what happens before either method detects anything. By the time a fault is visually apparent or a relay trips, insulation damage is often already severe. According to the CIGRE Working Group A2.37 Transformer Reliability Survey, which analyzed 964 major failures across 167,459 transformer-years, winding and bushing failures are the leading failure categories — both driven primarily by thermal and insulation degradation mechanisms that develop gradually over time.
Consider what that degradation timeline looks like in practice:
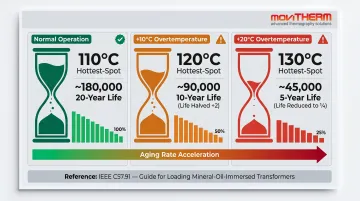
- Insulation begins aging at elevated temperatures long before any visible symptom appears
- Per IEEE C57.91, every 10°C above rated thermal limits halves insulation service life
- A transformer running 20°C hot doesn't trip any relay — it just ages at four times the normal rate
- Normal insulation life expectancy at the 110°C hottest-spot reference is approximately 180,000 hours (~20 years); sustained overtemperature compresses that to a fraction
That degradation gap — invisible to inspectors, silent to relays — is precisely what Condition-Based Monitoring (CBM) is designed to close. Rather than fixed maintenance schedules, CBM continuously evaluates transformer status using diagnostic data and triggers intervention only when anomalies are detected.
The CIGRE Technical Brochure 630 defines CBM as maintenance dictated by actual asset health rather than calendar intervals. In practice, that means fewer unnecessary maintenance actions and a far smaller window for catastrophic failures to develop undetected.
Critical Parameters in a Real-Time Transformer Health Monitoring System
Temperature
Winding and ambient temperature are the most actionable health indicators available. The distinction matters: winding temperature reflects internal conditions (typically inferred from oil temperature plus load-based calculations), while surface and enclosure temperature reflects external conditions — and this is where thermal imaging excels.
Overheating is the primary degradation pathway for transformer insulation. Two temperature thresholds matter most:
- 140°C hottest-spot — above this, gassing in solid insulation and oil can begin
- 180°C conductor temperature — permitted under emergency loading only; dielectric failure risk at this level is high
Monitoring both internal temperature trends and external hot spots gives operators the earliest possible warning.
Load Current and Voltage
Current sensors detect overload conditions in real time. When load current exceeds rated capacity, heat generation increases non-linearly — a 20% overload produces far more than 20% additional heat. Voltage monitoring tracks phase imbalances, harmonics, and transients that stress transformer windings without necessarily triggering overcurrent protection.
Oil Level and Dissolved Gas Analysis (DGA)
For oil-cooled transformers, oil serves dual roles: insulation and cooling. Two monitoring priorities:
- Oil level — ultrasonic sensors detect sudden drops that indicate leaks before they become critical
- Dissolved gas content — DGA sensors detect gases (hydrogen, acetylene, methane, CO) that indicate specific internal fault types
IEEE C57.104-2019 defines four condition levels based on total dissolved combustible gas (TDCG): Condition 1 (below 720 ppm, satisfactory) through Condition 4 (above 4,630 ppm, risk of failure). Online DGA sensors monitor these levels continuously rather than waiting for annual or quarterly oil sampling.
Faults that generate acetylene — associated with high-energy arcing — can progress from Condition 1 to Condition 4 between periodic sampling intervals. Continuous monitoring closes that gap.
Vibration and Humidity
Vibration sensors identify mechanical anomalies: loose cores, winding deformation, or inter-turn faults. Core vibrations typically appear at twice the power frequency (100 Hz for 50 Hz systems). Fast Fourier Transform (FFT) analysis converts time-domain readings into frequency-domain signatures, making specific fault types identifiable from their harmonic patterns.
Moisture ingress into transformer insulation oil is an equally serious degradation pathway. Key thresholds to monitor:
- High-voltage units: moisture must stay below 10 ppm
- Standard distribution transformers: typically tolerate up to 20–30 ppm
- Increasing moisture from 10 ppm to 50 ppm can reduce oil breakdown voltage by more than 50%
Sensing Technologies That Power Real-Time Transformer Monitoring
Contact-Based Electrical Sensors
Current transformers (CTs) and potential transformers (PTs) are wired into the transformer's electrical circuit and provide direct measurements of load, voltage, and power quality — including harmonic content and transients. Solid-state sensors such as the ACS712-type offer simpler installation for lower-voltage applications. These sensors require physical connection to energized circuitry, which demands de-energization during installation.
DGA and Chemical Sensors
Online DGA sensors continuously sample dissolved gas concentrations in transformer oil. They're preferred for critical assets over periodic oil sampling because they detect early-stage internal faults — arcing, partial discharge, thermal degradation — months before those faults progress to failure. The IEEE C57.104-2019 DGA interpretation framework provides the standard classification structure for calibrating alerts against gas type and concentration thresholds.
Thermal Imaging Cameras
Infrared cameras provide non-contact surface temperature mapping of transformer enclosures, bushings, cooling fins, and connection points. The key advantages over contact sensors:
- No physical connection to energized equipment
- No shutdown required during inspection or monitoring
- No gels, couplants, or surface preparation
- Detects hot spots invisible to the naked eye
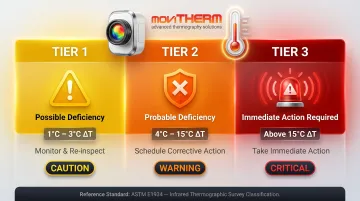
ASTM E1934 establishes severity classifications for thermal anomalies: 1-3°C delta-T indicates a possible deficiency; 4-15°C indicates a probable deficiency; above 15°C requires immediate action. These tiers map directly to tiered alert configurations in a monitoring platform.
A fault diagnosis study using thermal imaging on oil-immersed transformers achieved 98.7% detection accuracy — validating infrared thermography as a high-confidence diagnostic method for this application.
That accuracy only holds when cameras run continuously. MoviTHERM's fixed thermal camera solutions — supporting FLIR A-Series and Optris PI/Xi cameras — include the Optris PI 450i CM and PI 640i CM packages, specifically configured for continuous outdoor substation monitoring. Each package ships with the camera, outdoor enclosure, integrated heater and fan, and an operating range of -40°C to 50°C.
Paired with the iTL Monitoring Platform, these systems deliver 24/7 hot-spot surveillance with multi-channel alerts (text, voice, and email) without requiring on-site personnel.
IoT Microcontrollers and Communication Protocols
Platforms like the ESP32 aggregate multiple sensor inputs, perform local preprocessing (noise filtering, threshold comparison), and transmit data via Wi-Fi, GSM, or LoRa. Edge computing — processing at the device — reduces latency and maintains alerting capability even during network interruptions. Cloud-only approaches offer more analytical depth but depend on consistent connectivity.
Which protocol fits depends on what infrastructure is already in place:
| Protocol | Best For |
|---|---|
| MQTT | Lightweight IoT sensor data transport |
| Modbus TCP | SCADA/PLC integration |
| DNP3 (IEEE 1815) | Legacy North American utility SCADA |
| IEC 61850 | New greenfield substation automation |
| HTTP/REST | Cloud API integration |
MoviTHERM's iTL Gateway supports Ethernet/IP, Modbus/TCP, MQTT with TLS, and built-in cellular LTE with automatic failover — handling both IoT and industrial integration in a single unit.
How a Real-Time Transformer Health Monitoring System Works
Data Acquisition
Sensors are physically installed on or near the transformer and connected to a microcontroller or IoT gateway. Data is sampled continuously (or at configurable intervals), with multiple sensor streams — temperature, current, gas concentration, vibration — aggregated before transmission.
That aggregation layer is where edge preprocessing happens: filtering noise, flagging outliers, and comparing readings against local threshold configurations.
Transmission, Storage, and Preprocessing
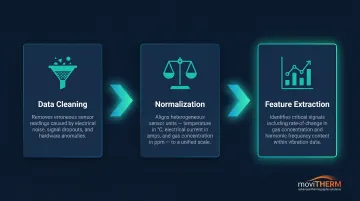
Acquired data transmits to a centralized cloud or on-premise platform. Before analysis, three preprocessing steps clean the data:
- Data cleaning — removing erroneous readings from sensor noise or communication dropouts
- Normalization — creating uniform scales across different sensor types (temperature in °C, current in amps, gas in ppm)
- Feature extraction — identifying meaningful indicators such as rate-of-change in gas concentration or harmonic content in vibration signatures
Analytics and Machine Learning
The monitoring platform analyzes data against historical baselines and threshold values using two complementary approaches:
- Rule-based alerting — fixed thresholds aligned with IEEE/IEC standards (e.g., DGA Condition 4, ASTM E1934 delta-T tiers). Transparent, auditable, trusted by maintenance engineers
- ML-based anomaly detection — algorithms including Random Forest, SVM, and deep learning identify patterns that threshold rules miss
Random Forest models using DGA gas ratios as input features have achieved 99.71% fault classification accuracy on standard transformer datasets — outperforming conventional Duval Triangle and Rogers Ratio methods. However, ML models introduce interpretability challenges. The most successful implementations, including Hydro-Quebec's transformer condition monitoring program, use a layered approach: standards-based thresholds for baseline alerts, with ML analytics providing supplementary predictive insights.
Alerting and Dashboard
Once the analytics layer flags an anomaly or threshold breach, results surface immediately through operator-facing tools. Operators access real-time transformer status, historical trend charts, and predictive maintenance schedules through a web dashboard from any connected device. Alerts dispatch via SMS, email, voice calls, or app notifications.
MoviTHERM's iTL Studio delivers this layer with:
- 24/7 remote access to thermal image streams and trend data
- Configurable alarm polygons and spotmeters for precision monitoring
- MapVIEWS for facility-level situational awareness
- Scheduled email reports for shift handoffs and compliance records
The platform's Virtual Auto-Dialer handles voice call notifications to designated personnel — critical for after-hours events when email alone won't guarantee a timely response.
Continuous Feedback Loop
Every confirmed fault and dismissed false alarm feeds back into the model, tightening accuracy over time. When maintenance teams log outcomes, that data drives periodic retraining — keeping the system aligned with changing operating conditions and aging transformer behavior.
This matters because the largest segment of North American transformers is 51-55 years old. Aging assets respond differently than new ones, and a static model calibrated years ago will eventually drift out of sync with real-world conditions.
Key Considerations When Implementing Transformer Health Monitoring
Sensor Selection by Transformer Criticality
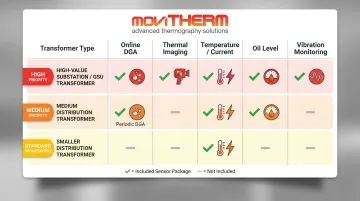
Not every transformer needs the same sensor suite. Match sensor investment to asset value and failure risk:
| Transformer Type | Recommended Sensors |
|---|---|
| High-value substation / GSU | Online DGA + thermal imaging + temperature + current + vibration |
| Medium distribution transformer | Temperature + current + oil level + periodic DGA |
| Smaller distribution transformer | Temperature + current monitoring |
Physical placement is equally important. Thermal cameras need unobstructed line-of-sight to bushings, cooling fins, and connection points. Contact sensors must be installed on de-energized equipment.
Pan-tilt units can extend a single camera's coverage to multiple transformer bays. MoviTHERM's pan-tilt systems offer 360° continuous rotation with payloads up to 90 lbs, making multi-bay coverage from one mounting point practical.
Threshold Calibration and Alert Tuning
Poorly calibrated thresholds generate false alarms. Maintenance teams that receive repeated false alerts stop responding — defeating the system's purpose entirely.
Best practice: establish baseline readings over several weeks of normal operation before setting alert thresholds. Then configure tiered alerts:
- Warning level — anomaly detected, investigate when convenient
- Critical level — threshold breached, respond immediately
Tiered alerting preserves urgency. Teams respond faster when critical alerts are genuinely rare and warnings handle routine anomalies.
Integration with Existing Infrastructure
Evaluate compatibility with existing SCADA, CMMS, and network architecture before selecting a monitoring platform. Key questions:
- Does the platform support Modbus TCP for PLC/SCADA integration?
- Can it transmit data via cellular if substation Ethernet is unavailable?
- Does it integrate with your CMMS for maintenance work order generation?
MoviTHERM's MIO (Intelligent I/O Module) supports Modbus TCP/IP with 4-20mA analog outputs for direct SCADA/PLC integration. The iTL Gateway adds cloud monitoring with cellular failover for sites where substation Ethernet is unreliable.
Working with a specialist provider from the start — covering camera selection, mounting design, network architecture, and integration — reduces deployment time and avoids the costly rework that comes from discovering compatibility gaps mid-project.
Frequently Asked Questions
What is a transformer health monitoring system?
A transformer health monitoring system uses sensors, data acquisition hardware, and analytics software to continuously assess transformer operating condition. It detects anomalies — overheating, overloading, oil degradation, mechanical faults — before they cause failures, enabling condition-based maintenance instead of reactive repairs.
What is a transformer health monitoring system using IoT?
An IoT-based system connects sensors (temperature, current, oil level, gas, vibration) to internet-enabled microcontrollers or gateways that transmit data to cloud platforms for real-time analysis and automated alerting. This eliminates the need for manual on-site inspections and enables remote monitoring from any connected device.
How do you check the health of a transformer?
Traditional methods include physical inspection, oil sampling, and periodic DGA testing. Modern continuous monitoring adds permanent sensors and fixed thermal cameras that track transformer condition 24/7, providing far earlier warning of developing faults than periodic visits alone — particularly for slow-developing thermal and insulation degradation.
Why is it important to monitor transformer health and reliability?
Transformer failures cause unplanned outages, safety hazards, and replacements that now take 120+ weeks to fulfill. Proactive health monitoring extends service life, reduces maintenance costs, and ensures reliable power delivery. 60% of industry professionals reported a transformer failure in the past five years, and 50% said such a failure would significantly impact or halt operations.
What IoT devices are commonly used for transformer health monitoring?
Common hardware includes:
- Microcontrollers: ESP32, Arduino
- Temperature sensors: DS18B20, PT100 RTDs
- Current sensors: ACS712, CTs
- Other sensors: ultrasonic oil level, DGA, vibration (SW-420), humidity (DHT22)
- Fixed thermal imaging cameras
All transmit data via Wi-Fi, GSM, LoRa, or Ethernet to cloud platforms for analysis.