In This Article
Flash Thermography NDT Technique
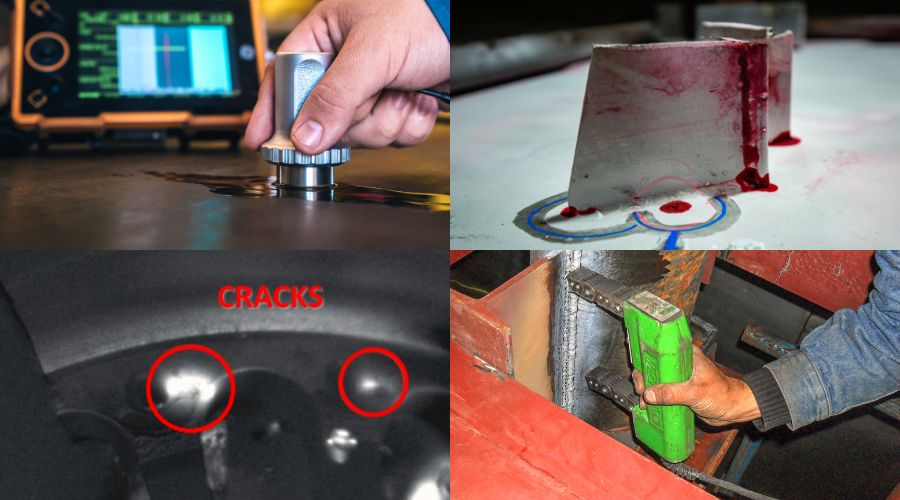
Flash Thermography is an active thermography method for the non-destructive evaluation of materials. Non-destructive evaluation (“NDE”) or non-destructive testing (“NDT”) are often used interchangeably. Flash thermography is considered an active thermography inspection method, because the part under test is commonly at ambient temperature. Examining the part with a thermal camera would not produce any contrast in the image, since there are no significant temperature differences across the part surface. In comparison, using a thermal camera to “passively” look at an electrical motor would yield a high degree of thermal contrast in the image, due to the self-heating of the motor during operation.
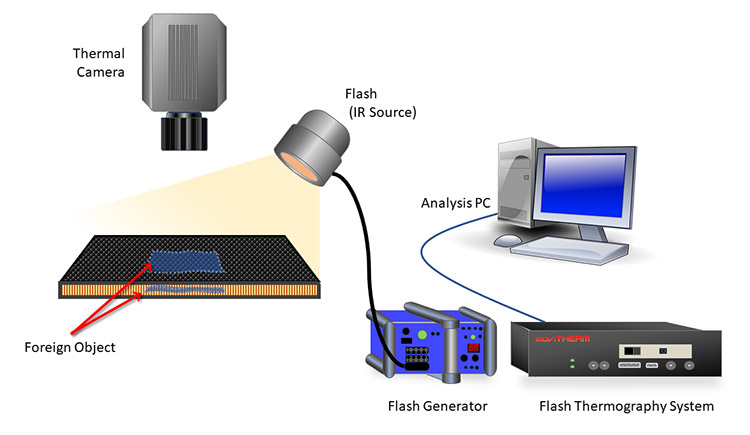
Example of a Flash Thermography System
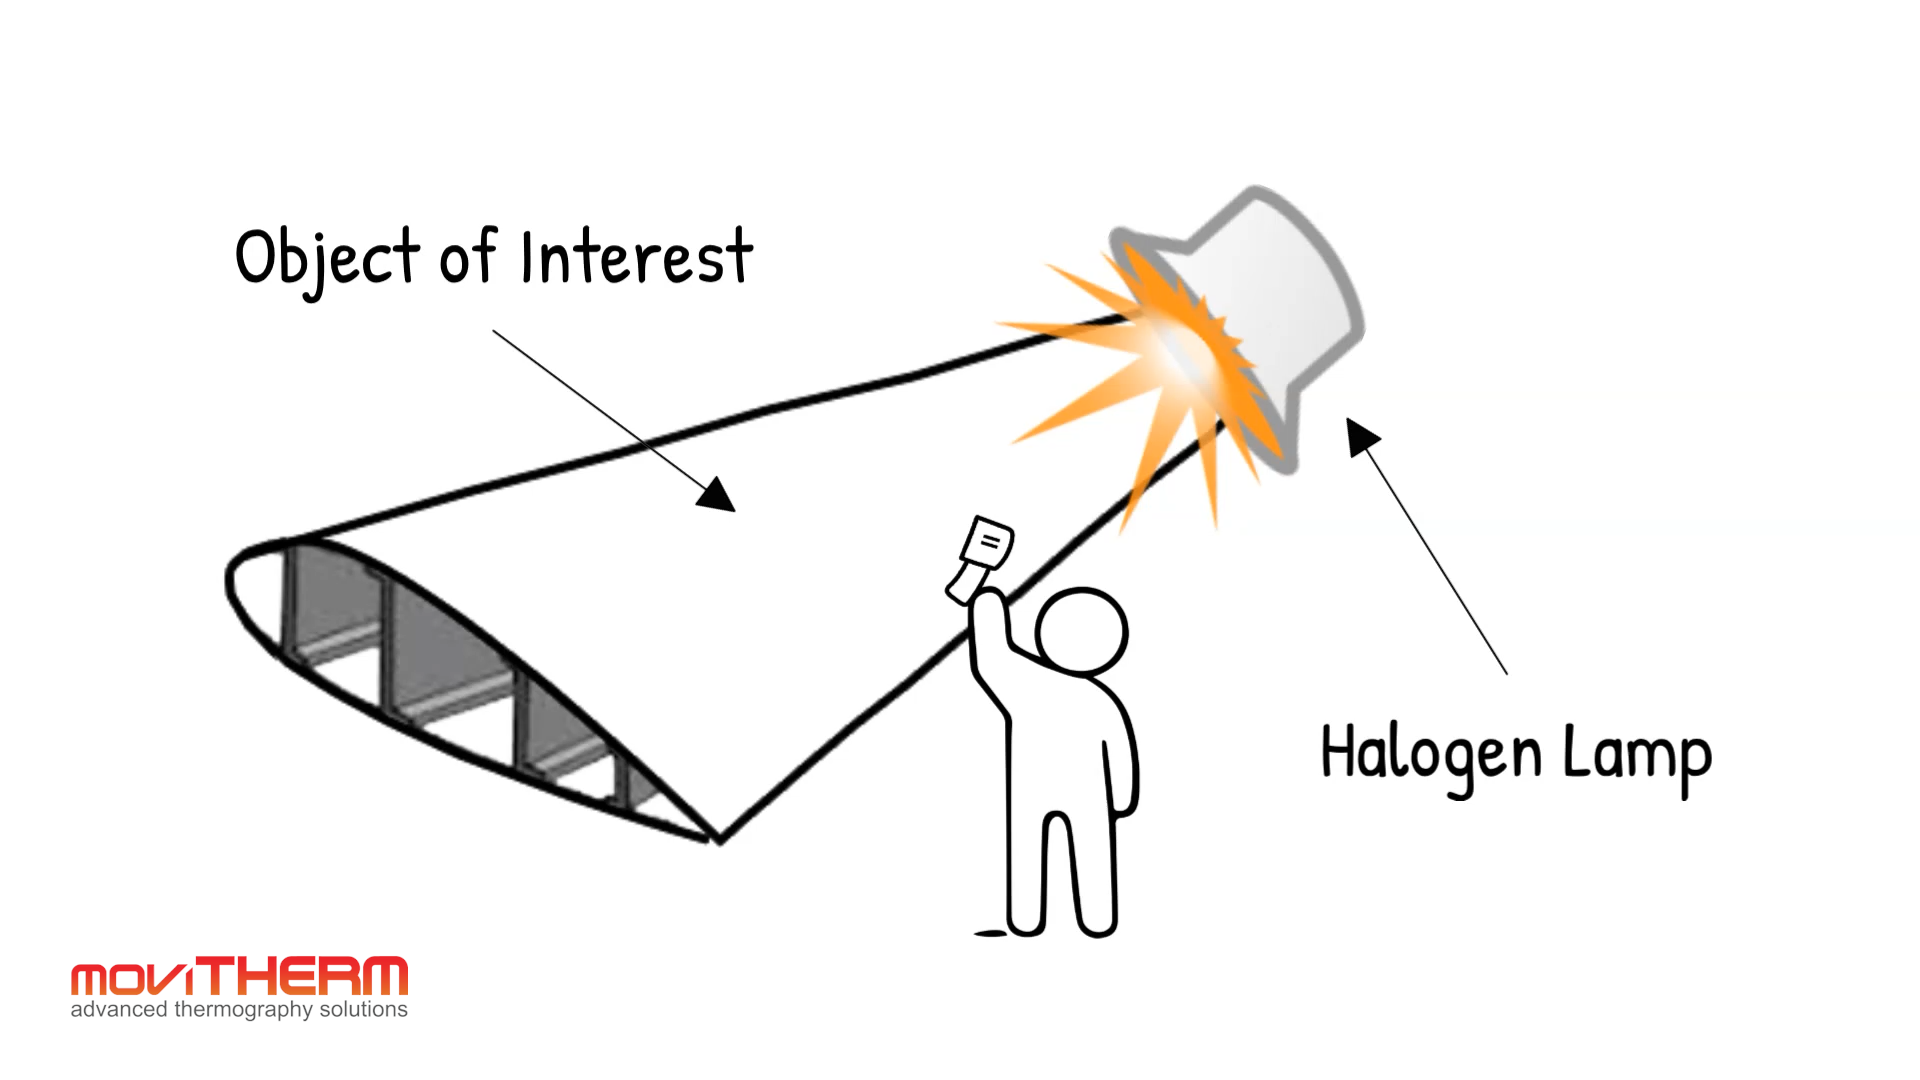
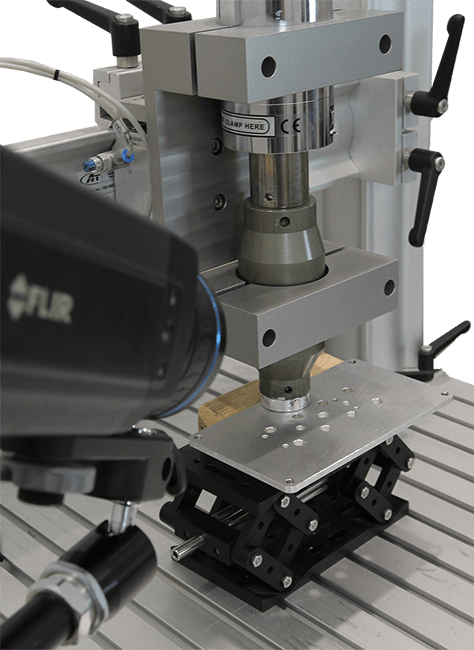
A flash thermography system uses its own heat source to induce heat into the part. This is done to allow an active examination of the thermal behavior at the surface of the part. The “flash” part of a flash thermography system in this case, is considered the excitation source. The flash lamp creates a short, high-energy heat pulse which is directed at the surface of the part.
The flash duration is often on the order of 2 milliseconds or less. The objective is to illuminate and therefore heat the part surface captured by a thermal camera as evenly as possible. The thermal camera records the changes in surface temperature by capturing a thermal video, consisting of many image frames. The software of the flash thermography system then post-processes that thermal video sequence and performs complex math on a pixel-by-pixel basis. The created thermal wave penetrates the part in depth and travels back to the surface, which is being observed by the camera.
In a homogeneous region of the part with no defect, heat travels at the same rate. However, an area with a defect, such as a delamination, void or foreign material inclusion, disturbs the thermal wave on the surface. These temporal changes or differences of the thermal wave are being converted to contrast changes in the result image. Different mathematical algorithms have been developed to accomplish this. Some work better for fast responding materials, such as metals, and others work better for materials that don’t conduct heat very well, such as carbon composites or plastics.
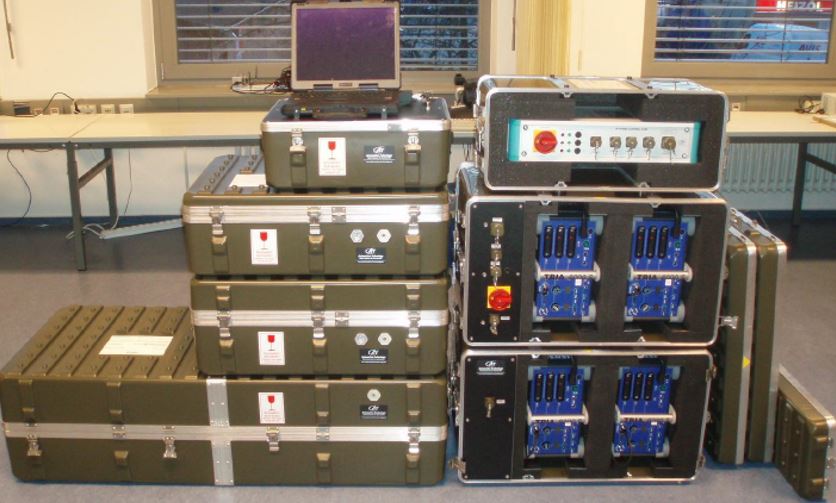
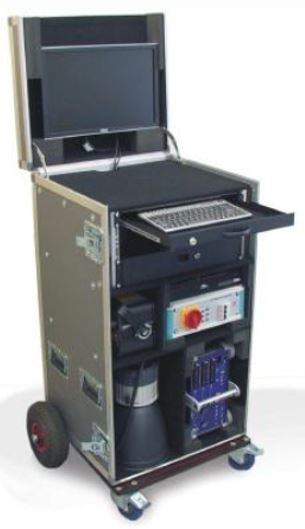
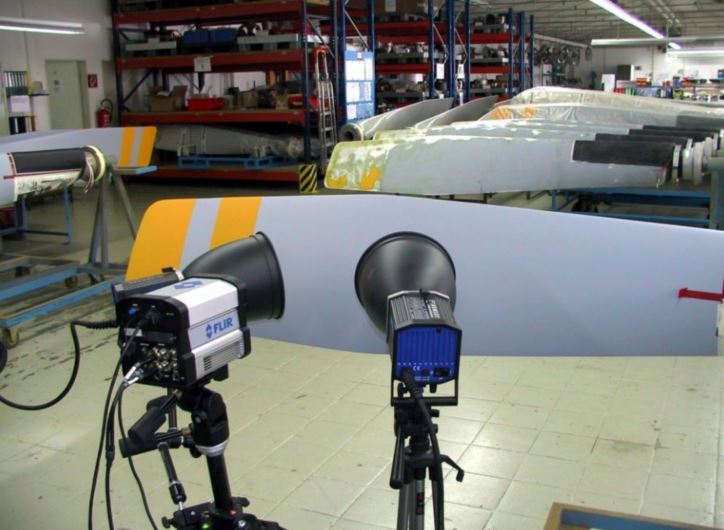
Example Configurations of Flash Thermography Systems
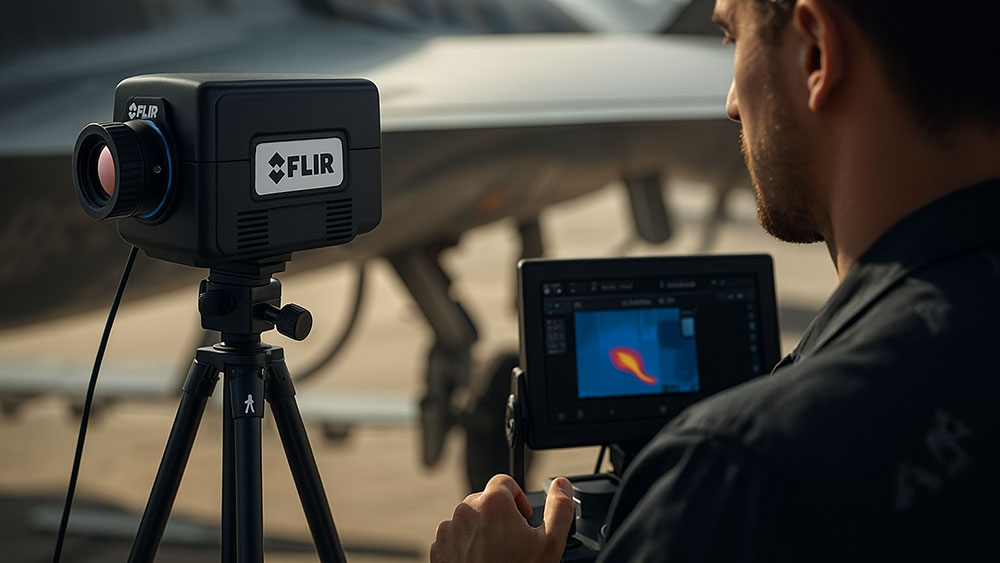
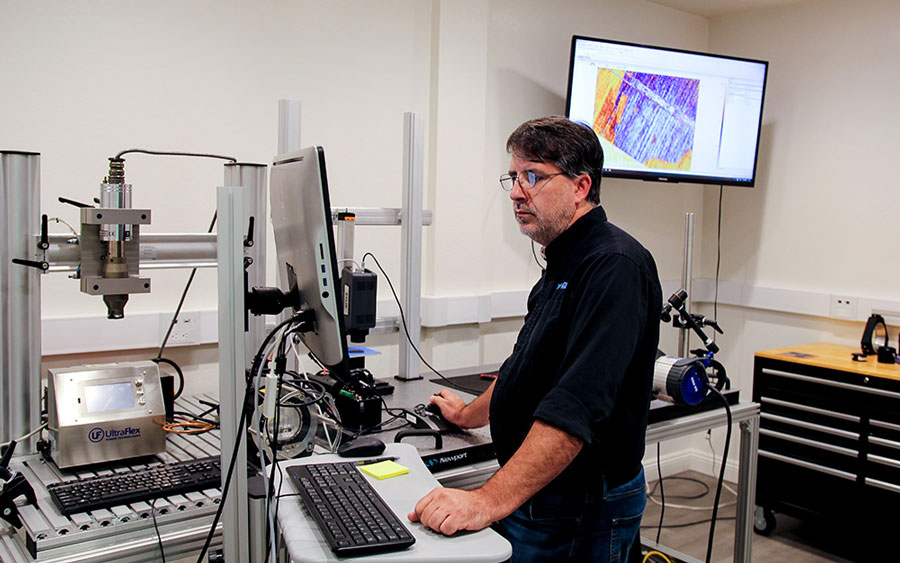
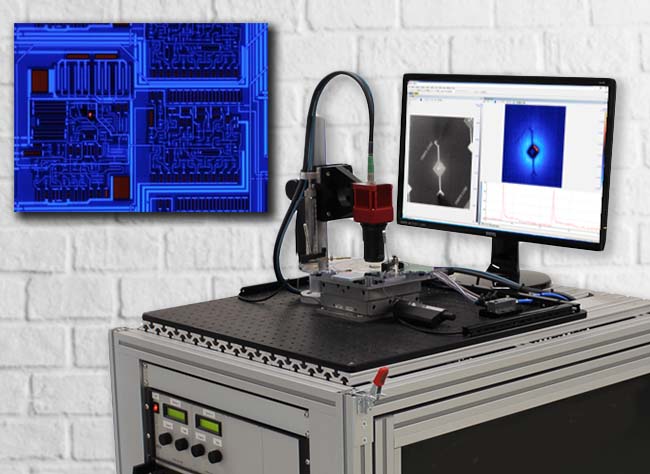
The photos below show different configurations of flash thermograpy systems. From left to right: The first photograph shows a high-end system that was developed for a military application. All systems components are integrated into military style flight cases. That particular system was equipped with six flash generators (blue devices). Each generator delivers 6 kJoule of flash energy for a total of 24 kJoule. The photo next to it shows a combination flash thermography system with transient thermography capability. That system is integrated into a standard flight case with casters. The photo to the right shows a FLIR camera on a tripod next to a flash lamp on a tripod. The setup was used to inspect aircraft propellers for defects. The photo on the very right shows a result image from one of the propellers with an edge defect – a delamination.
How is a flash thermography measurement performed?
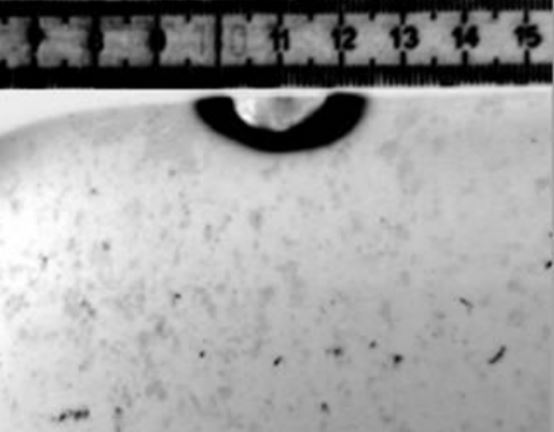
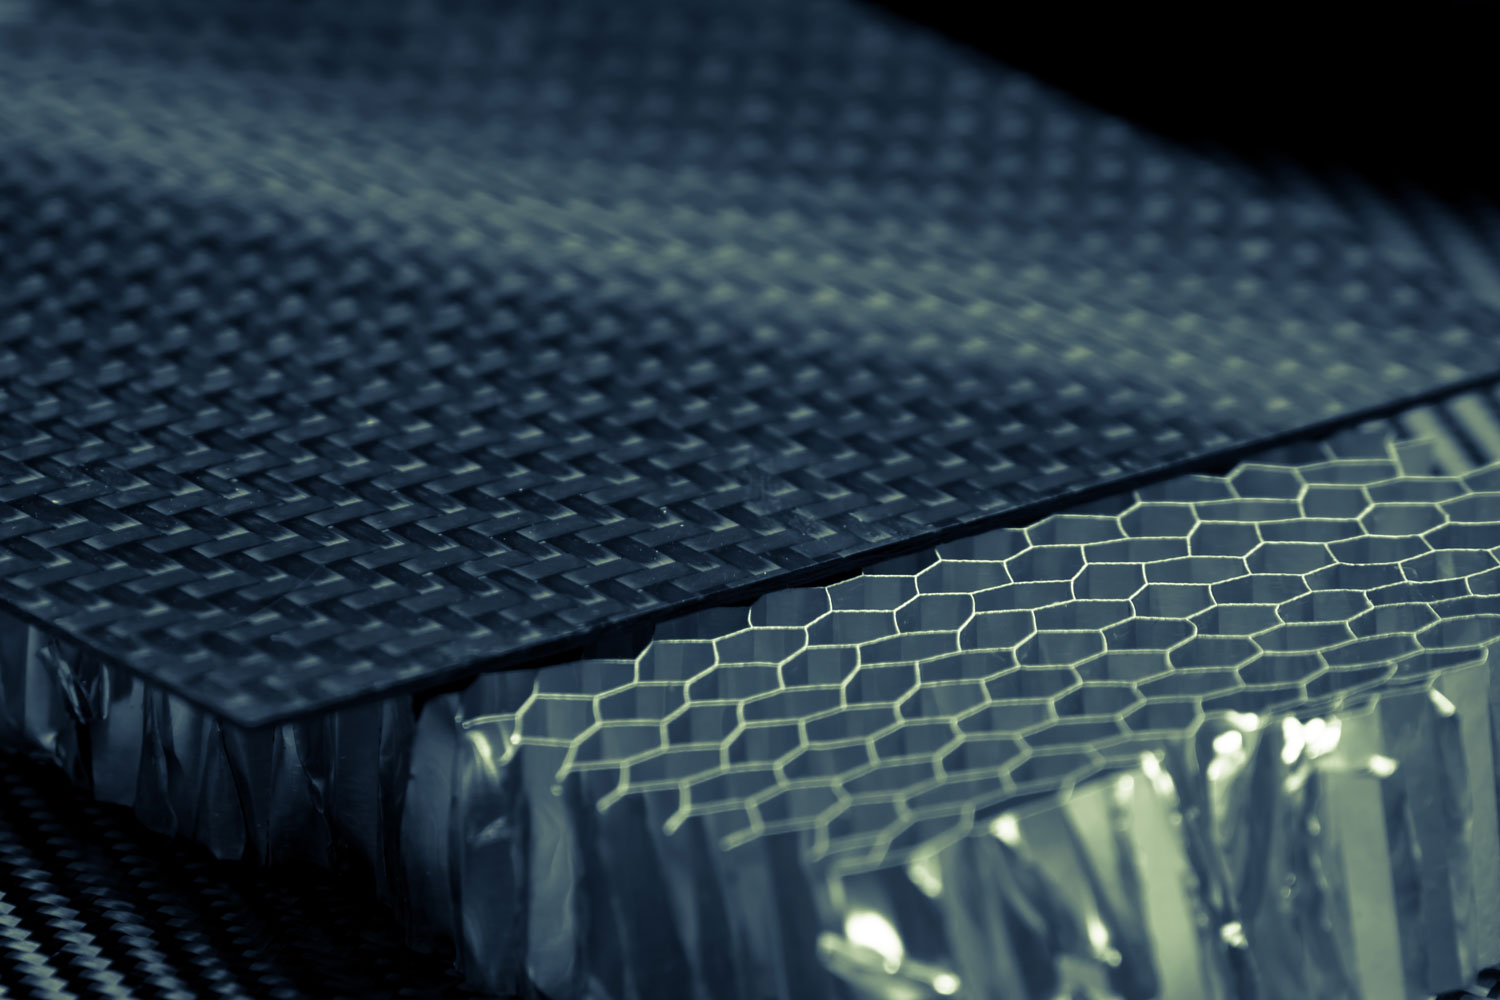
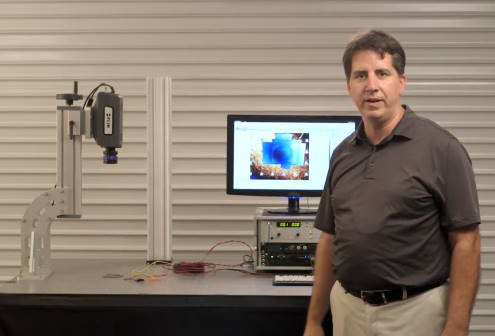
The following video shows an overview and demonstration of our flash thermography system. For this demonstration we were using a pre-impregnated (“Prepreg”) carbon composite sample with three plies. Inside the sample there was a triangular piece of poly-film to simulate a defect or foreign object (“FOD”). This is a very typical scenario in today’s composite manufacturing industry. Smaller pieces of poly film sometimes get stuck or left behind from the backing material of the prepreg. The leftover piece of the peel-ply then becomes part of the carbon-composite layup or sandwich. Depending on the size of the FOD, this may lead to structural issues in the finished part. This is especially true for carbon composite structures that are exposed to high-stress. These pieces of peel-ply typically go unnoticed until much later, when the finished part is undergoing a final non-destructive test regimen, typically with ultrasonic testing. Detecting FODs this late can become very costly, as some parts may have to be scrapped.
Flash Thermography on the other hand, can be applied to the uncured prepreg and provides a quick verification of the layup prior to curing the part. Typically, a flash thermography system can detect FODs to about three plies deep. The heat injected into part from the flash is negligible and will not start the curing process prematurely.
A measurement only takes a couple of seconds, as can be seen in the video. This process can be further automated for larger and curved parts, using a collaborative robot and some of MoviTHERM’s automated image processing solutions.
Flash Thermography is very well suited for surface and near surface defects. However, it is very depth limited in materials that do not conduct heat very well, such as composites. The maximum penetration depth is typically around 1.5 to 2 mm for such materials. If the material thickness exceeds 2mm, we recommend switching to a transient thermography solution instead.
Signal Processing – The key to achieving good results!
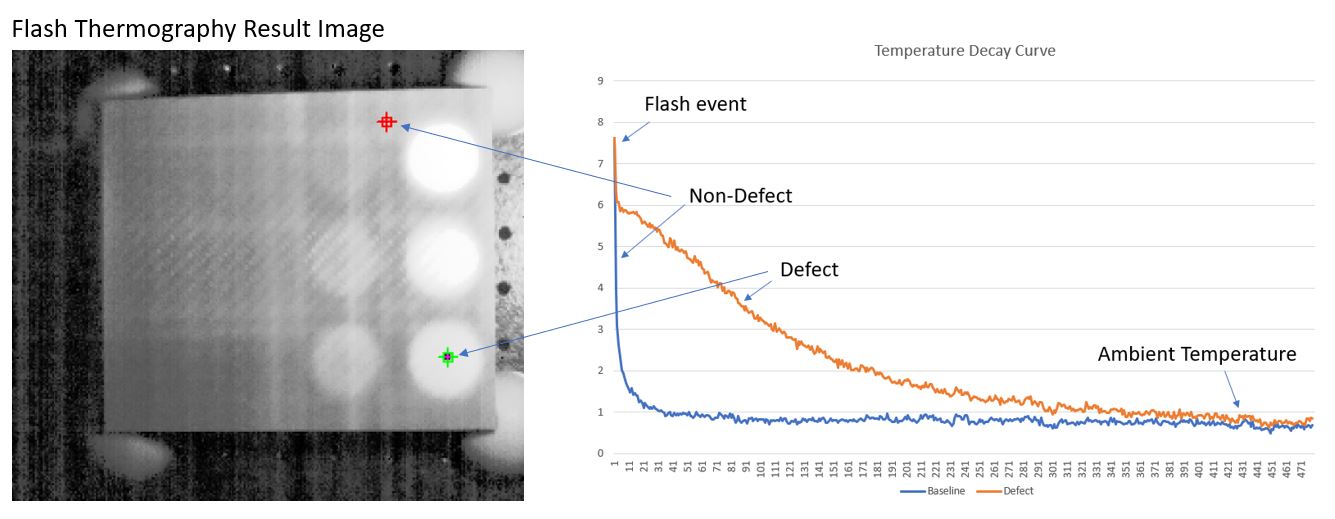
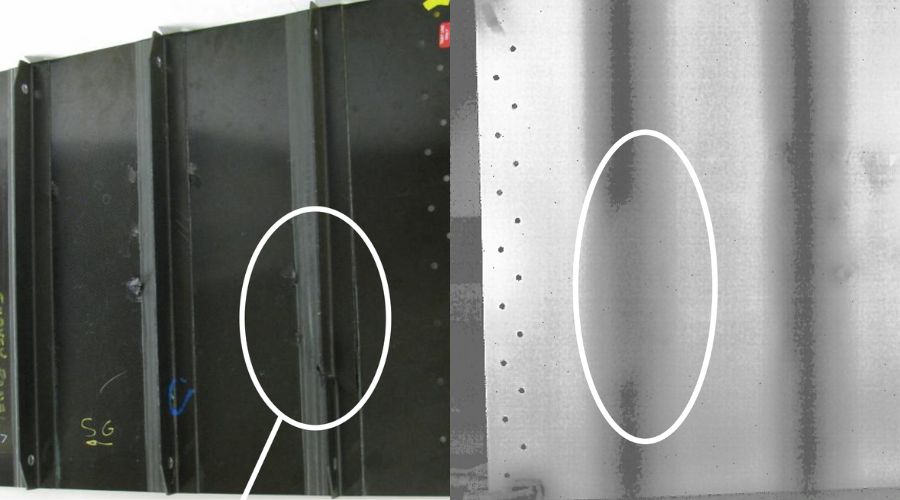
The photo below shows a result image of a flash thermography measurement. The sample is a carbon composite coupon with flat holes of different depth. Two cursors have been placed on the image to measure temperature vs. time. The red cursor has been placed (baseline) over a non-defective area. The corresponding graph is blue. The green cursor has been placed over a “void”, represented by a flat hole. The graph color for this cursor is orange.
At time time zero, the flash introduces a sharp rise in temperature over the non-defective area as well as over the void. When the part starts to cool off, the orange graph clearly departs from the blue, indicating a different cooling behavior. The two graphs meet again when the part has reached equilibrium around ambient temperature. The difference in the rate of cooling is being exploited with an advanced signal processing technique. In fact, our Flash Thermography system offers several signal processing algorithms to choose from. The signal processing math is applied to every pixel in the image for the entire recorded video sequence.
Areas with different cooling behavior will be converted into a different gray level, resulting in a change in contrast and brightness for non-homogeneous areas in the material. The graph below only demonstrates the signal for two pixels in the image for a simplified illustration. The Y-axis in the graph area calculated units and not temperature. The X-axis are the number of images recorded.
Flash Thermography Temperature Decay
How large of an area can be inspected?
When determining the size of the inspection area, several things need to be considered:
a) The spatial resolution of the thermal camera
b) The size of the flash lamp and the area it can uniformly illuminate
c) The geometry of the part
Spatial Resolution of Camera vs. Smallest Defect Size
The available number of pixels of the camera are being projected onto the part surface. These are contained within the field of view of the camera, which determines the size of the inspection area. For example, a camera may have a detector with 640 x 512 pixels. Any given defect needs to be covered with a minimum of 3 x 3 pixels, ideally more. If the smallest defect size of concern is 0.25″, this would result in 0.25″/3 = 0.08″/pixel. If we multiply this by the horizontal camera resolution, we get the total area we can inspect in one measurement. 0.08″/pixel x 640 pixels = 51.2″. For the vertical size of the field of view, we take 0.08″/pixel x 512 pixels = 40.96″. So the largest field of view size for a single measurement can therefore be ~50′ x 41″.
This is a rather large area. However, we also need to be concerned with how large of an area our flash lamp can cover and produce a uniform heat rise. This may require 2 to 4 flash lamps. With a single flash lamp we can reasonably achieve about 14″ x 12″.
Part Geometry
The part geometry also plays an important role when considering the total size of the inspection area. Curved surfaces can lead to non-uniform illumination of the flash light as well as reflections. Parts with complex geometries may require multiple smaller inspection regions compared to flat surfaces.
Depth Limitation
There are two depth limitations to consider. The first is a limitation due to thermal conductivity of the material. For example, a carbon composite material does not conduct heat very well. A flash lamp discharges all of its energy within 2 msec onto the surface of the part. A purely conducting (heat) material will prevent the thermal wave from penetrating the part very deeply. A rule of thumb is that flash thermography is limited to about 1.5mm to 2.0mm in penetration depth.
The second limitation comes from a ratio of the defect size to its depth in the part.
Depth limitation (diameter/depth) = ~1.4
The 1.4 factor does not consider any advanced signal processing techniques being applied to the result images. So this ratio can be improved to 1.0 to 1.2, depending on various factors. What this ratio says is that the diameter of the defect needs to be at least as large as its depth. However, as we have learned, the penetration depth for flash thermography is often limited much sooner by the thermal conductivity of the material. However, in order to inspect for defects in composites that are located deeper than about 2mm, we can utilize transient thermography instead. Transient thermography allows us to overcome this depth limitation. Another alternative to Flash Thermography is Lockin Thermography.
Example Flash Thermography Application
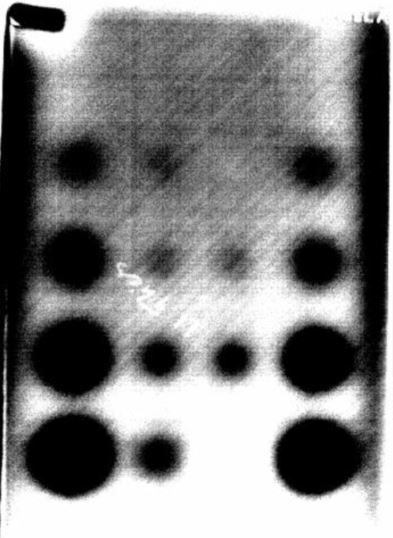
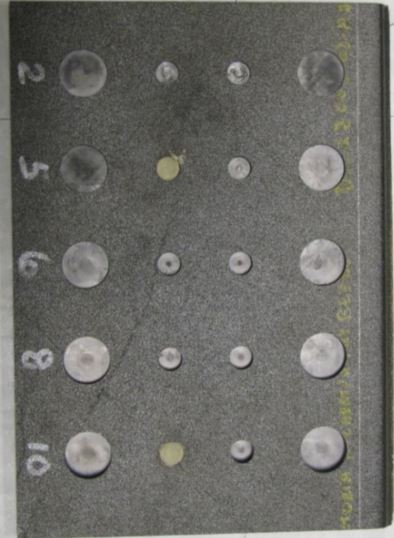
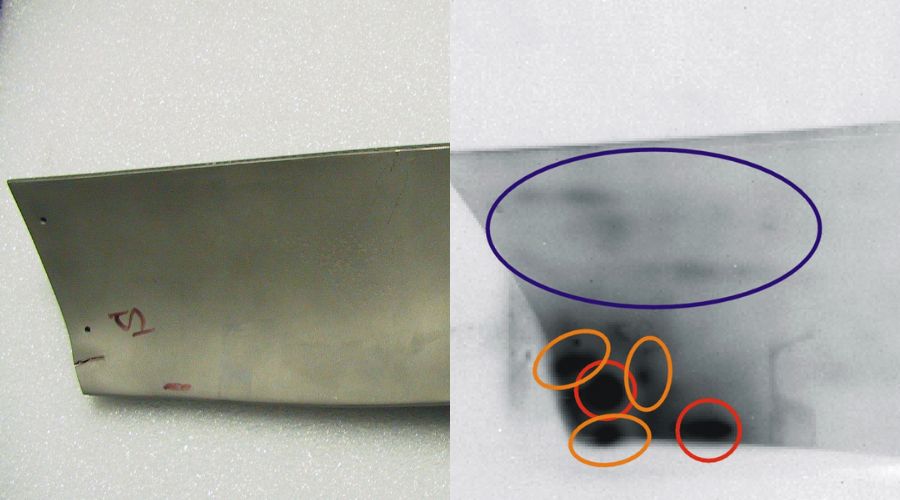
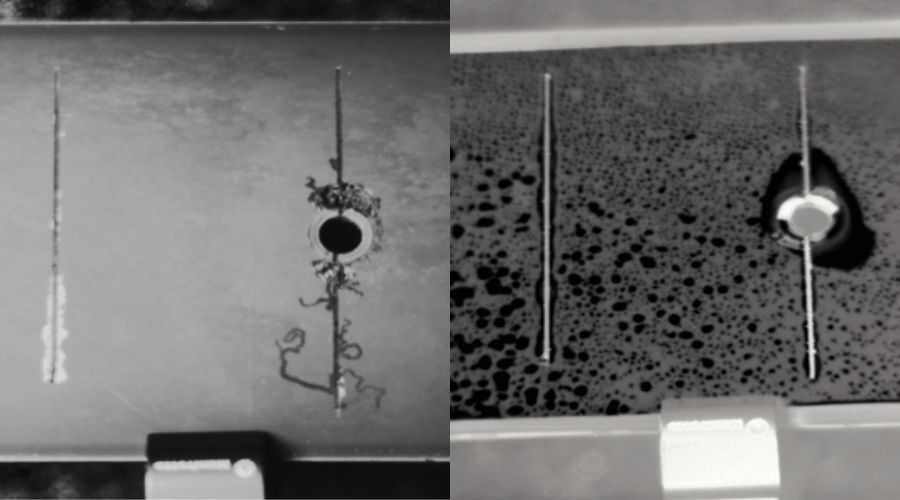
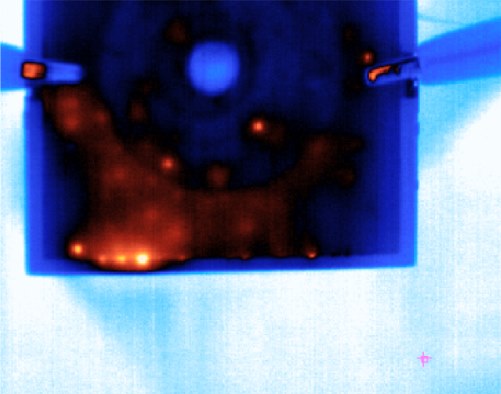
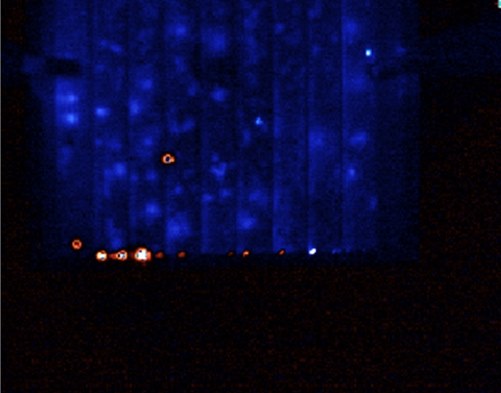
This is an example application of a flash thermography inspection. The image on the left shows a sample coupon. There are several flat bottom holes drilled into the coupon with varying sizes of diameter and depth. This is a typical test and verification coupon to make sure the flash thermography system is working as expected. It is always a good practice to validate the system with a known standard, before proceeding to inspect critical parts.
The image on the right shows the results from the flash thermography measurement. The holes show up as dark circles. Some of the more shallow ones fade out and some do not show up at all anymore. The ones that do not show up are deeper than about 2mm and exceed the penetration limit of a flash thermography method.
Do you have parts that could benefit from a flash thermography inspection?
MoviTHERM offers NDT Feasibility Studies to help our customers evaluate their application challenges and how well an thermal, infrared non-destructive test method will perform. Learn more about our feasibility study offering!
The image on the right shows the results from the flash thermography measurement. The holes show up as dark circles. Some of the more shallow ones fade out and some do not show up at all anymore. The ones that do not show up are deeper than about 2mm and exceed the penetration limit of a flash thermography method.


About moviTHERM
Founded in 1999 and headquartered in Irvine, California, moviTHERM is a leading provider of thermal imaging and remote monitoring solutions for early fire detection, condition monitoring, non-destructive testing, and quality inspection. The company designs and deploys complete thermal monitoring systems — integrating best-in-class infrared hardware with its own software platforms to serve clients across industrial, aerospace, energy, and manufacturing markets.


