MoviTHERM

About MoviTHERM

This author has not yet filled in any details.
So far MoviTHERM has created 156 blog entries.

Using Thermography For Battery Inspection

Using Infrared Thermography for Battery Inspection

Battery Inspection using Active Thermography becomes more important in order to stay competitive. Manufacturers of lithium-ion Batteries (LIB) are challenged with maximizing battery performance and minimizing costs to keep the adoption of LIB technology economically attractive.

From toothbrushes to automobiles, earbuds to mobile devices, and toys to semi-trucks, lithium-ion Battery technology is finding its way into just about everything. As such, the demand for battery materials, innovation in electrode design, improvements in manufacturing, and optimization of charge density are ever-increasing.

In this article, we discuss how active thermography and non-destructive testing (NDT) can be used for battery inspection at various stages of the manufacturing process to minimize electrode defects, optimize material usage, and ensure product quality.

Lithium-Ion Battery Anatomy

A lithium-ion battery consists of multiple parts with the cell acting as the primary component. The cell is the workhorse of the battery and is comprised of the following materials:

Current Collectors

The current collectors are the two battery ends with positive and negative connection points. These connections points are used for charging (power to) and discharging (power from) the battery.

Cathode

The cathode stores lithium and is the positive electrode made from a chemical compound metal oxide.

Anode

The anode stores lithium and is the negative electrode typically made from carbon.

Separator

The separator restricts the flow of electrons inside the battery but allows for lithium ions to pass back and forth from the cathode and anode electrodes.

Electrolyte

The electrolyte fills between the electrodes and carries the lithium ions from the anode and cathode during charge and discharge.

movitherm battery inspection anatomy

Battery Inspection Anatomy

Lithium-Ion Battery Operation

The operation of a lithium-ion battery is all about the back-and-forth movement of lithium ions between the cathode (+) and anode (-) electrodes. The ions move in one direction during charging (absorbing power) and in the opposite direction during discharge (supplying power). When the ions no longer flow the battery is either fully charged or discharged.

Charge Phase (Absorbing Power)

During the charge phase, with external power applied, lithium ions will migrate from the positive cathode to the negative anode through the separator and electrolyte. At the same time, electrons will flow from the cathode to the anode, however, unlike the lithium ions, the electrons cannot pass through the separator and take a different path around the outer circuit. Arriving at the anode, the electrons and ions combine. The battery is fully charged and ready to use when no more ions can flow.

movitherm battery inspection anatomy

Battery Inspection Anatomy

Discharge Phase (Power From)

During the discharge phase, the lithium atoms in the anode are ionized and separated from their electrons. The lithium ions migrate through the separator and electrolyte from the negative anode to the positive cathode. Simultaneously, the free electrons flow from the anode to the cathode electrode via the outer circuit, providing power to an external device like a laptop computer. The ions and electrons recombine at the cathode becoming electrically neutral. The battery is fully discharged when no more ions can flow and needs charging to supply power again.

movitherm battery inspection anatomy discharge

Battery Inspection Anatomy

Lithium-ion Battery Manufacturing Process

The following graphic illustrates the battery manufacturing process, which includes three major parts: electrode preparation, cell assembly, and battery electro chemistry activation.

movitherm battery inspection battery manufacturing

Battery Manufacturing Process

1. Slurry Preparation:

the active material (AM), conductive agent, and binder are mixed to form a uniform slurry with the solvent.

2. Coating and Drying:

The slurry is pumped into a slot die, coated on both sides of the current collector (Al foil for cathode and Cu foil for the anode), and delivered to drying equipment to evaporate the solvent.

3. Calendering:

The electrodes are compressed by driving through a two-cylinder press. This will help adjust the physical properties (bonding, conductivity, density, porosity, etc.) of the electrodes.

4. Cutting Electrodes:

The finished electrodes are stamped and slitted to the required dimension to fit the cell design. The electrodes are then sent to the vacuum oven to remove the excess water.

5. Cell Assembly:

After the electrodes are well prepared, they are sent to the dry room with separators for cell production. The electrodes and separator are winded or stacked layer by layer to form the internal structure of a cell. The aluminum and copper tabs are welded on the cathode and anode current collector, respectively.

6. Electrolyte Filling & Formation:

The cell stack is then transferred to the designed enclosure. Manufacturers use a variety of packaging depending on the cell application. The enclosure is filled with electrolyte before the final sealing and completes the cell production.

Battery / Electrode Performance

At a basic level, any factors that impact the travel of lithium-ions between the cathode and anode electrodes within a battery will impact performance of that battery. As such, the design, manufacturing, and operation of a battery should be to optimize ion and electron flow.

Within the manufacturing process there are instances when defects and flaws might be introduced into the battery product. For example, during the Coating & Drying step the forming electrodes become potentially susceptible to the following:

  • Uneven compound spread/thickness variation
  • Variation in carbon to polymer binder ratio
  • Scratches
  • Air bubbles/blisters

Other performance damaging factors can result from the introduction of contamination particles into the electrode foils. During coating, calendaring, and slitting electrode foils can be exposed to delaminated particles, abraded metallic particles, and dust from the production environment.

The introduction contaminants, defects, and flaws will adversely affect the ion / electron ability to travel within the electrochemical cell and thus reduce battery performance.

Active Thermography for Battery Inspection and Quality Control (QC)

IR Thermography has shown to be an effective non-destructive testing method for QC in multiple industries for various applications. The basic operation of an IR camera is based upon the heat transfer principle of radiation. The infrared camera has within it a focal plane array of detector elements that “see” infrared light radiated from object surfaces. The radiation captured by the infrared camera detector is digitized, converted to data, and displayed as an image that can be viewed in the visible spectrum. Certain infrared cameras are radiometrically calibrated to record and display measurement units. Infrared cameras are available with different sensors and pixel resolutions to see specific infrared wavebands.

movitherm battery inspection

Advanced Thermography for Battery Inspection and Quality Control (QC)

Flash Thermography for Battery Inspection

Battery Inspection using active Thermography involves the excitation of the target and has been found to be most effective in the detection of flaws and contaminants of battery electrodes. Flash IR thermography is a form of active thermography where the target is exposed to a flash of thermal energy and the subsequent change in surface temperature is monitored by an IR camera. A thermal wave signal sequence is acquired by a computer with real-time image signal processing and analysis revealing how the thermal energy passes from the surface to the interior of the target. If the target has voids or defects, the thermal conduction paths will be disrupted. These disruptions lead to temperature differences on the surface that are detected by IR thermography.

movitherm battery inspection ndt

Flash Thermography for Battery Inspection

In general, an increase in the temperature profile suggests the presence of contaminants and agglomerates, while a decrease in the temperature profile indicates pinholes and blisters.

Another Battery Inspection application uses active flash thermography directly following the cell assembly stage where anode and cathode electrodes are welded together, and arrester tabs are attached. Welds are critical since they determine internal contact resistance which impacts charging times, power output, and heat generation. Additionally, weld strength against wear and fatigue will determine the lifetime of the battery.

By analyzing the heat propagation through the weld with advanced thermography, determinations can be made about the weld structure and electric conductivity. In general, high thermal conductivity indicates good welds that are uniform with good penetration and positive current flow.

movitherm battery inspection performance detractors

Battery Performance Detractors

Conclusion

Battery Inspection and Monitoring electrodes, cells, and batteries along the production path can help identify faults and defects early, allowing for quick production condition adjustment. Identifying product quality issues closer to generation points will reduce scrap, improve product quality, and optimize production costs.

Active thermography has proven to be an effective inline NDT method for evaluating and diagnosing the production of lithium-ion batteries. It can be used to identify the introduction of contamination particles and the formation of defects during the electrode creation stages. Additionally, Battery Inspection using active thermography can be an effective tool for evaluating welds in cell creation and battery packing.

2024-08-16T17:23:50-07:00Thursday, March 21, 2024|Blog|

6 Things to Know Before Buying an EBT System

What You Need to Know Before Buying an Elevated Body Temperature Screening System

Elevated Body Temperature Screening

This article discusses six topics you need to know before buying a thermal camera. There are so many options out there, it can quickly can overwhelming. Especially when you have no background in using thermal cameras for elevated body temperature screening or “EBT”.

This “6 Things you need to know before buying a thermal camera for elevated body temperature screening” article and accompanying video is intended for readers that are in the research and decision making process. Which thermal camera screening solution is right for me?

I have witnessed about 30 new “solutions” and entire new companies enter the market, just in the past two month alone. There is so much misinformation out there and so many false claims, that I felt compelled to write this article and make this video. The COVID-19 crisis has brought out the best in people and unfortunately also the worst.

A lot of companies are currently investing significant sums of money into technology they do not understand the first thing about. A lot of vendors out there didn’t even know how a thermal camera worked two months ago and are now calling themselves experts.

Elevated body temperature screening (EBT) not only requires an in depth understanding about thermography, but also a solid understanding of physiological effects of the human body. In particular, how the body thermally regulates.

Visit our Youtube channel for more educational video content: https://www.youtube.com/user/movitherm

Some companies promote their solutions as “fever screening” cameras. This is a misleading statement, since no thermal camera has ever been cleared by the FDA for fever screening.

These cameras can merely detect a variation in skin surface temperature. My name is Markus Tarin, and I am the President & CEO of MoviTHERM – Advanced Thermography Solutions.

I have spent the past 20 years developing thermal imaging systems for industry and research. Never before have I seen such a frenzy and unethical business practices when it comes to thermal cameras being offered for elevated body temperature screening.

When I started to learn about thermal imaging technology, back in the 90s, it took a go six months to get a fundamental understanding about the infrared spectrum, heat radiation, conduction, convection, emissivity, reflectivity, transmissivity and all the other fancy physical effects that influence the accuracy of a thermographic measurement.

So I empathize with so many of you out there trying to make an “informed” purchase decision within a very short period of time. Many of you may not even have an engineering background, let alone the ability to interpret technical specifications of thermal cameras. Now add to this the complexity of human physiology and how the body’s thermoregulation may skew the results of an optical instrument used for temperature measurement.

The reality is that you won’t have enough time to properly understand enough about these subject matters to truly make an educated and sound decision. What you are left with, is often the marketing literature of the solution provider. And their whole purpose is to play into the panic and fear around this subject matter to sell you their solution.

I felt compelled to share my knowledge and help educate people on this topic. For that purpose, I have put together six topics and boiled them down to the essentials. Hopefully people will find some value in this. This article is not meant to be an exhaustive “training course” or white paper by any stretch of the imagination. Rather, it is meant to convey some basic concepts to separate the marketing hype from technical facts.

Topic# 1 – How does a Thermal Camera work?

A thermal camera captures the radiated infrared energy from the surface of a solid object. The captured energy is then mathematically converted to a temperature reading. The temperature reading of each pixel of the camera is then being associated with a color, representing a temperature.

The absolute accuracy of a thermal camera depends on many factors. Considering all factors (Emissivity, spatial resolution, detector and system noise, temperature drift etc.), the expected accuracy of these cameras is no better than ±2° Celsius or ±3.6 °Fahrenheit. It technically can’t be better, unless you are placing the thermal camera into a very tightly controlled thermal chamber under laboratory conditions.

This is due to the fact that the image detector in the camera, the lens and the electronics warm up and create a temperature drift. Without active temperature compensation, this drift is a large contributing factor to the achievable accuracy on these cameras. All the cameras that are being offered for elevated body temperature screening are based on microbolometer type detectors.

Micro-Bolometer Pixel

Micro-Bolometer Pixel

I have to get technical – sorry…

I have seen marketing literature lately, that claim a camera accuracy of +/- 0.5C without the use of an external black body i.e. calibrated temperature reference source. They back up the claim with the fact that the entire calibrated temperature range was optimized for human body temperature, rather than the typical 170C to 350C range of typical thermal cameras. It is true that using a smaller dynamic range potentially helps with accuracy. However, this also requires a higher degree of amplification. With amplification comes additional noise. If the detector has an NETD of 0.05k (50mK) at 30C. The best theoretical accuracy achievable is about 10 times NETD. So 0.05K x 10 = 0.5K or 0.5C, ignoring all other error sources. Typical dynamic ranges of microbolometer detectors require a 14bit analog to digital converter. So, in order to make use of the largely reduced dynamic range, one would have to amplify the signal from the detector. This will also amplify the detector noise and hence will affect the achievable accuracy negatively. None of this helps and none of this deals with the temperature drift problem.

Takeaway: Achieving an accuracy of 0.5C with a microbolometer detector based camera requires one of two things:

  • Active cooling and temperature control of the lens, the detector and signal electronics, which none of these have OR
  • Using a external temperature reference source (aka black body, that is stabilized to better than +/- 0.5C)

Topic# 2 – What can a Thermal Camera detect?

A thermal camera can only detect, measure and document the variations of skin surface temperatures.

It cannot detect or diagnose any of the following:

  • If somebody has a fever or not.
  • If somebody is sick or healthy.
  • If somebody has an infection of any kind.
  • If somebody is contagious or not.

A diagnostic decision can only be rendered by a healthcare professional, using other FDA approved methods (fever thermometer, blood test, viral tests etc.)

A thermal camera used for this application requires an FDA 510k clearance. With such a clearance, it can be used as an “adjunct” screening tool for skin surface temperature measurements. It shall never be used on its own to render any diagnostic decision.

Topic# 3 – How to properly measure elevated body temperature?

Thermal image of tear duct

  • Body temperature is correlated closest at the inner canthus/tear duct.
  • Measuring skin surface temperatures anywhere else in the face, will not work properly.
  • Eye-wear will obstruct the tear ducts and must me removed
  • Person should be standing still at a fixed distance to the camera
  • The inner canthus should be covered by sufficient number of camera pixels to allow for an accurate measurement. (At a minimum 3 x 3 pixels, ideally more)

Topic# 4 – What camera pixel resolution do I need?

  • The tear duct area is about 5mm. We need at a minimum 3 pixels to cover that region for an accurate measurement.
  • 5mm / 3 pixels = 1.6mm/pixel
  • Using a thermal camera with 320 pixels, we can capture an image size of 320 pixels x 1.6mm/pixel = 512 mm [~ 20 inches]
  • Using a camera with 160-pixel resolution, we are left with an image size of ~10 inches.
  • Therefore, pointing a camera into a crowd to detect elevated body temperature will not work.
  • Assuming an image size of 5 feet, it would require a thermal camera with >12 Megapixels and these do not exist.

Topic# 5 – Reference Black Body vs. Reference Population

Reference black body

  • There are two legitimate measurement setups available for elevated body temperature measurement.
  • One uses an external black body reference to increase the accuracy of the measurement to about ±0.5° Celsius or better.
  • The other one uses a relative comparison of skin surface temperatures (baseline group)
  • Both setups are valid and require a manual correction from time to time to account for external factors that are impacting the thermoregulation of the human body.
  • Thermoregulation is the ability of the human body to keep its inner core temperature stable.
  • Core body temperature is: 36.4–37.1 °C (97.5–98.8 °F)
  • The body will either try to conserve energy or try to get rid of excess energy to maintain its ideal core temperature.
  • This results in increased or decreased skin surface temperatures, as the skin is the
    interface to the environment.

Topic# 6 – Which solution can I trust?

  • Be aware of “ambulance chasers”. More than 30 new solutions and companies have been created in the past two months.
  • Work only with reputable companies with a proven track record.
  • How long has the solution they are selling been on the market? Was it successfully used during previous pandemics, such as SARS & Swine Flu?
  • Be aware of false camera accuracy claims.
  • Be aware of fully automated systems.
  • Be aware of low-cost solutions.
  • Do not buy a solution that claims to be able to scan more than one person at a time. (Crowd scanning).
  • Be aware of false claims in marketing literature and websites.
    (i.e. Fever detection, avoids spreading infection, any diagnostic claims, keeping you safe etc.)
  • Not all thermal cameras and solutions are created equal!

So, what is an example of a trust worthy solution?

FLIR a310

  • FLIR A320 Tempscreen
  • Originally developed for previous pandemics, such as SARS, Swine Flu etc.
  • Installed thousands of times around the world at airports, public buildings etc.
  • Proven solutiontried and tested.
  • FDA 510k Clearance for skin surface temperature measurements.
  • Manufactured by the world’s largest manufacturer of thermal camera – FLIR Systems, Inc.

Would you like to discuss your concerns and questions with me personally? Then go to the Contact Us section and schedule a free consultation today!

2024-08-16T17:23:58-07:00Thursday, March 21, 2024|Blog|

IR Cameras Used for Elevated Body Temperature Screening

Infrared Cameras Used for Elevated Body Temperature Screening

The Coronavirus outbreak in Wuhan, China has grabbed the attention of people around the globe. Thermal cameras are being deployed in record time for screening of elevated body temperature at airports and other public places.

However, as useful and capable as this technology is, there is a lot of misinformation circulating in the news. As with the implementation of any technology, there are challenges. It is important to understand the physics involved that affect the accuracy of an optical temperature measurement, but moreover, there are many other factors to consider related to bio-physical phenomena.

Being unaware of how these intricate details is crucially important.

“Knowing what works and why it works can make the difference between having a cool-looking piece of equipment and an effective tool that assists in the screening effort.” – adds Markus Tarin, President & CEO, MoviTHERM

FLIR Facial Thermography Infographic

We commonly see thermal imaging system setups that simply point a thermal camera into a crowd. This sort of setup is significantly flawed, when considering all factors that contribute to the accuracy of measuring human elevated body temperature.

More specifically, how skin facial temperature correlates to core body temperature. Based on scientific research (referenced below), the most reliable spot in the human face is the eye canthus.

A small area over the tear duct. The eye canthus is strongly correlated to the inner body core temperature and has been found to the most reliable location on the face.

Image: Courtesy of Ross Overstreet, Flir Systems, Inc.

The image to the left shows the relationship between the camera distance to subject and the measured skin temperature. Two subject were used, a seven year old male and a 44 year old female. Both subjects were imaged under the same conditions.

Moving the camera from 0.5 meter to 6.0 meter away from the subject, resulted in a temperature drop of about 2 degrees Celsius. This is due to the decreasing resolution of the number of pixels projected over the eye canthus, when moving the camera further away from the subject. Compounding this issue is the fact that the standard accuracy of a thermal is only +/- 2 degrees Celsius to begin with. These sort of issues, when compounding would lead to a greater than 50% uncertainty in the screening system at best.

Sufficient number of pixels (spatial resolution) is required for a thermal camera to accurately measure the skin surface temperature. With the limited amount of pixel resolution available, this poses a challenge when imaging a subject, even at a modest distance. Most cameras deployed for elevated body temperature screening have a resolution around 320 x 240 pixels or 640 x 512. This is very low when compared to traditional surveillance cameras. The FLIR A320 Tempscreen camera was specifically designed for this application.

Rather than using a reference temperature source (“black body”), the FLIR A320 Tempscreen uses a different approach to assuring the skin surface temperature measurements are as accurate as possible. For this, the FLIR A320 Tempscreen uses a population baseline. FLIR suggests using about ten known healthy individuals, scan them with the camera and save their readings. All future subjects scanned will be compared to this population baseline.

A better (and necessary) approach to solving the resolution vs. distance challenge is to control the distance to the subject. This is not feasible when pointing a camera into a crowd. The following setup would create a more controlled measurement setup. Since the accuracy of most thermal cameras are only +/- 2 degrees Celsius to begin with, another step has to be taken.

Body temperature screening setup

A calibrated temperature reference needs to be placed in the field of view during the measurement. The reference source, also referred to as a “black body” allows the imaging software to calibrate the scene to a more precise value by providing a higher accuracy reference, than the camera is capable of.

The black body needs to be located at the same distance from the camera, as the face that is being imaged. The active area (heated region) of the black body also needs to be covered with sufficient pixels to yield the desired results. Ideally a pixel cluster of 10 x 10 pixels.

With this approach, temperature measurements of 5 to 10 times the NETD of the camera are possible. Or about +/- 0.5 degrees C. Cameras that support a black body as a reference source are the new FLIR A400 and FLIR A700 Smart Sensor cameras.

This video explains how thermal imaging technology can be used to screen for people with an elevated body temperature. We have seen a lot of misinformation lately from sources claiming that you can simply point a thermal camera into a crowd and “detect” anybody infected with the Coronavirus.

We want to set the record straight and explain the technology in layman’s terms. How thermal cameras work; how you can use thermal imaging to measure skin temperatures and what you can and cannot detect.

There are also several pitfalls and challenges with this technology when it comes to detecting somebody with an elevated body temperature. Things that can affect the accuracy of the measurement are:

  • Makeup
  • Physiological Stress
  • Sweating
  • Insufficient Camera Resolution
  • Measuring the wrong location on the face
  • Not using a reference black body for calibration
  • Using the wrong camera
  • Subject motion

… just to name a few.

Related Scientific Research

Below are some research papers that take a deeper dive into the challenges that are being discussed in this video.

Best practices for standardized performance testing of infrared thermographs intended for fever screening. Pejman Ghassemi,T. Joshua Pfefer, Jon P. Casamento, Rob Simpson, Quanzeng Wang. September 19, 2018

International travels and fever screening during epidemics: a literature review on the effectiveness and potential use of non-contact infrared thermometers. Bitar D, Goubar A, Desenclos J C. Euro Surveill. 2009.

Comparison of Infrared Thermal Detection Systems for mass fever screening in a tropical healthcare setting. M.R. Tay, Y.L. Low, X. Zhao, A.R. Cook, V.J. Lee ,Public Health, 2015.

Infrared thermal imaging of the inner canthus of the eye as an estimator of body core temperature. Teunissen, L. P. J., & Daanen, H. A. M. (2011). Journal of Medical Engineering & Technology.

Disclaimer

No products or solutions offered, promoted, marketed or sold by MoviTHERM, without limitation, are intended for any medical or health-related use on humans. (Collectively, the “offerings”). No offerings, whether verbal or in writing, without limitation, are approved by the US Food and Drug Administration or any other governmental agency to diagnose, treat, cure or prevent any disease, including, without limitation, any use for temperature measurement in humans. Any customer, reseller, integrator, agent, representative, end-user or operator (collectively “Customer”) further acknowledges and agrees that, should Customer engage in any Health-Related Uses, Customer shall be solely responsible for ensuring compliance with the applicable laws and regulations, including, without limitation, the Federal Food, Drug, and Cosmetic Act and the regulations promulgated thereunder by FDA, for the use of any Product for the Health-Related Uses and for obtaining and maintaining any approvals, clearances, licenses, registrations, or permits required by FDA or any other governmental authority for the use of any Product for the Health-Related Uses.


2024-08-16T17:24:06-07:00Thursday, March 21, 2024|Blog|

Seal Inspection Using Thermal Cameras

Seal Inspection Using Thermal Cameras in Your Process Line

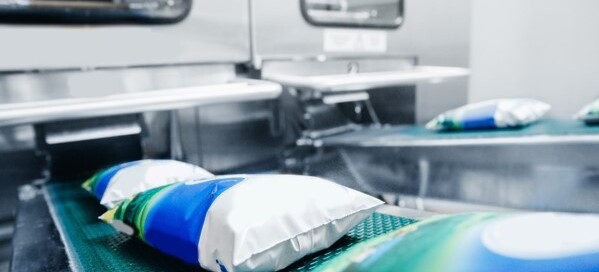
Many packages for food, medical, pharmaceutical, supplies and other goods are packaged in bags that are being sealed using heat. Thermal bag seal inspection refers to using a thermal camera to inspect the heat signature of the bag seal, immediately after sealing.

There are several different methods of how the bag seal is being heated, but ultimately all lead to the same result. Two materials are being joined together forming a (hopefully) tight package seal.

How is a thermal seal created?

Thermal bag sealing or package sealing refers to a sealing concept that either heats up plastic materials to their melting point, thus allowing the materials to fuse together. Some package seal designs have a predetermined adhesive area to form the seal.

Induction Sealing of Bottle Caps

This method is commonly used in bottle cap applications. In case of the bottle cap seal, a liner is being inserted into the cap, prior to capping the bottle. The liner may be an aluminum foil or contain a layer of cardboard. The liner is coated with an adhesive that is facing towards the bottle. After the cap has been screwed onto the bottle, the bottle travels underneath an induction heater. The aluminum foil is now being heating by the eddy currents generated in the magnetic field of the coil of the induction heater while the bottle travels down a conveyor. The aluminum foil heats up and melts the adhesive. The pressure from the torqued cap assured that the cap liner adheres to the bottle after the adhesive has cooled down.

Platen Heat Sealers

Another common heat-sealing method is using heated plates. These plates are formed in the shape of the package seal area. Typical package designs are cups or containers with a plastic foil on top. The packages come down a conveyor line and the heated plate sealer pressed down onto the top foil transferring its heat into the package seal area.

Band Sealers

Band sealers are often found in continuous bag sealing applications. These allow the bags to be in motion during the sealing process. The bag is moved through the band sealer while the sealer transfers heat onto the bag seal.

Ultrasonic Sealers

Another common sealing technology for bag sealing uses ultrasound to create heat directly in the seal. This is commonly found in paper bag applications. Since paper does not melt together, an adhesive layer has been applied to the bag seal during the manufacturing process of the paper bag. The paper bag is then being inserted into the jaws of the ultrasonic sealer. A short burst of very powerful ultrasound energy is induced into the bag seal area. This causes the adhesive-covered bag seal areas to vibrate. The friction together with the vibration creates heat, which in turn melts the adhesive and forms the bag seal. All of this happens in a fraction of a second.

There are other bag sealing and package sealing methods and technologies besides these. For example Friction welding, Radio Frequency (RF) welding, and Laser welding to name a few. The previous examples are just some common examples found in the packaging industry.

The Need for Inspection

First off, not every package seal is critical. Therefore, not every package sealing application requires rigorous inspection.

Thermal imaging-based inspection systems are suited for critical packaging applications. Critical applications are applications in which a weak seal, an impartial seal, or even a small leak would lead to significant issues.

Sometimes these issues are related to product quality and have cosmetic reasons, other times the risk is much higher, such with maintain sterility in medical applications.

Thermal bag seal inspection offers a unique advantage, as it is a non-contact temperature measurement method.

However, based on the thermophysical properties of the materials used for the bag seal, the inspection can be challenging. Some materials are not suitable for thermal imaging-based inspections at all, such as certain metal films which may be highly reflective in nature. Even if the package material does not look very shiny to the human eye, it may still be problematic to inspect with a thermal imaging camera. This all comes down to physics and material properties, emissivity, transmission and reflection.

“It is for that very reason, that we here at MoviTHERM always start every bag seal application with a feasibility study. That allows us and our customers to properly evaluate how the materials behave in the infrared spectrum and whether the inspection application will work, before investing a lot of time and money.” – adds Markus Tarin, President & CEO, MoviTHERM

The Importance of the Inspection Location

Every thermal bag sealing application behaves differently and is sometimes unpredictable. Even if it has been determined that the thermophysical properties of the bag seal allow for reliable temperature measurement, there are still other challenges that need to be tackled. Depending on the level of heat input, the sealing temperature, as well as the physical mass in the sealing area and heat conductivity of the material, the heat in the seal, will spread at a different rate.

Thermal seal time sequence

Thermal image time sequence of heat seal.

The above pictures are thermal images taken from an ultrasonically welded seal. This time series illustrates how the thermal signature of the weld area changes over time. The first image (t=0 sec) has been taken immediately after the weld. In the last image (t=3.0 sec) you can see that the heat signature has significant changes.

Why does this matter?

Well, the more time passes from the time heat was induced into the bag seal, the more the heat signature diffuses. A side effect of that thermal diffusion is that the heat signature of the seal washes out and becomes very blurry. The heat energy from the hotter regions flows towards the colder regions.

So, if there is an area in the seal that wasn’t sealed properly, it tends to be colder than the surrounding regions. The thermal contrast this creates can be used to detect the defect in the bag seal. However, that thermal contrast starts to fade away, making the defect detection less reliable as time passes.

Application Story – Paper Bag Seal Inspection

To put all of this into context, let’s take a look at a real-world bag seal inspection application. The following example used a thermal camera and custom-developed thermal imaging software. The paper bags are being sealed with an ultrasonic sealer. Once sealed, the bags are being dropped onto a conveyor belt. A proximity sensor detects the bag and triggers the thermal camera. The thermal imaging software analyzes the heat signature of the bag and determines whether the seal is good or bad.

Paper pouch sealing setup

Paper pouch sealing setup.

The photo above shows the test setup. Visible are the ultrasonic bag sealer, the conveyor belt, the paper bag with the seal facing forward, the FLIR Thermal camera, and an industrial PC running the custom thermal bag seal inspection software.

Thermal Bag Seal Inspection – Conceptual Setup

The following illustration shows the setup that was used for the inspection setup. A proximity switch was used to trigger the thermal camera always at the right time after the sealing process.

paper pouch seal inspection setup

Paper Pouch Seal Inspection Setup – Conceptual

Determining the right time window for snapping the thermal image of the seal is crucial. Sometimes it actually takes some time for the heat to rise to the surface of the material. So taking the image either too early or too late will not yield satisfactory results.

The black and white image series is a thermal time series. We essentially stopped the conveyor belt. We then extracted six thermal images of the bag seal. The first image at t=0 sec, then t=2 sec, t=5 sec, t=8 sec, t=12 sec and the last at t=15 seconds.

The thermal signature of the seal between 0 to 5 seconds after sealing is still nicely pronounced. This seal is made up of two horizontal lines. Starting with image four (t=8 sec) the double line feature is starting to bleed.

Performing any meaningful thermal image analysis after 5 seconds will become very challenging.

This test helps us to determine where to place the thermal camera with respect to conveyor speed and the material-dependent behavior of this particular paper bag sealing application.

Paper pouch seal image sequence

Paper pouch seal image sequence.

Pass-Fail Detection with Respect to Inspection Location

The temperature equalization from warmer regions to cooler regions can result in a bad seal eventually appearing to be a good seal. This thermal equalization effect is graphically illustrated in the 3 images on the right. In a thermal bag seal inspection application, it is important to capture the image soon after the seal is applied.

The sooner the exposure, the more likely the inspection can catch the faults – before equalization can hide them. The light red regions represent the heat signature on the bag seal area that is above a certain temperature threshold.

The detected gap is a faulty seal area where there is insufficient heat present. This would lead to a broken or incomplete seal and may cause product to leak out or moisture to creep into the product.

Correctly understanding this thermal diffusion effect makes the difference between being able to properly identify sealing defects or not.

pass fail detection defective seal

Pass-Fail Detection

Good Seal Example

The example image below shows a thermal image (vertical seal orientation) and the corresponding processed image. A common machine vision processing step, called “image threshold” was applied to create a blob image. A blob image is a binary image with all pixels turned on that are above a certain threshold. The threshold in this example is directly related to the seal temperature.

What one would expect from a good seal is a continuous red area in the shape of the seal. Additional evaluation functions can be applied to further examine the quality of the seal. For example, one could measure the width along the sealing region and the length. Other options are looking for any orphaned blobs of disruptions.

The inspection strategy mainly depends on how the material behaves and how repeatable the results are. This is also impacted by dynamic behaviors of the sealer. During startup, the seal temperature may still be changing as the sealer warms up.

good seal example

Good seal example.

Faulty Seals Example

Depending on the application, there are several failure modes. It is good engineering practice to characterize the different failure modes to properly understand how these impact the heat signature of the seal.

faulty seal examples

Infrared image examples of faulty seals.

Common Challenges in Thermal Bag Seal Inspection Applications

There are plenty of challenges with thermal bag seal inspection applications. These stem from the sealing methodology, the thermophysical properties of the material, ambient and environmental conditions, and dynamic behaviors.

The list below is a summary of commonly encountered challenges in bag sealing applications:

  • Specific Thermal Conductivity (Rate of thermal diffusion)
  • Emissivity (Ability of the material to radiate heat)
  • Reflectivity (Low emissivity surface, reflections)
  • Transmissivity (Certain coatings and thin film plastics)
  • Motion blur due to fast moving parts
  • Aspect Ratio of sealing area vs. sealing width (Resolution problem)
  • Ambient Temperature fluctuations
  • Process drift (Start up, dynamic conditions etc.)
2024-08-16T17:24:19-07:00Thursday, March 21, 2024|Blog|

What is flash thermography?

Flash Thermography NDT Technique

Flash Thermography is an active thermography method for the non-destructive evaluation of materials. Non-destructive evaluation (“NDE”) or non-destructive testing (“NDT”) are often used interchangeably. Flash thermography is considered an active thermography inspection method, because the part under test is commonly at ambient temperature. Examining the part with a thermal camera would not produce any contrast in the image, since there are no significant temperature differences across the part surface. In comparison, using a thermal camera to “passively” look at an electrical motor would yield a high degree of thermal contrast in the image, due to the self-heating of the motor during operation.

flash thermography system graphic

Example of a Flash Thermography System

A flash thermography system uses its own heat source to induce heat into the part. This is done to allow an active examination of the thermal behavior at the surface of the part. The “flash” part of a flash thermography system in this case, is considered the excitation source. The flash lamp creates a short, high-energy heat pulse which is directed at the surface of the part.

The flash duration is often on the order of 2 milliseconds or less. The objective is to illuminate and therefore heat the part surface captured by a thermal camera as evenly as possible. The thermal camera records the changes in surface temperature by capturing a thermal video, consisting of many image frames. The software of the flash thermography system then post-processes that thermal video sequence and performs complex math on a pixel-by-pixel basis. The created thermal wave penetrates the part in depth and travels back to the surface, which is being observed by the camera.

In a homogeneous region of the part with no defect, heat travels at the same rate. However, an area with a defect, such as a delamination, void or foreign material inclusion, disturbs the thermal wave on the surface. These temporal changes or differences of the thermal wave are being converted to contrast changes in the result image. Different mathematical algorithms have been developed to accomplish this. Some work better for fast responding materials, such as metals, and others work better for materials that don’t conduct heat very well, such as carbon composites or plastics.

Example Configurations of Flash Thermography Systems

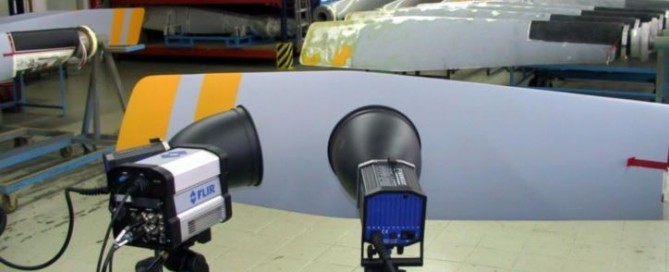
The photos below show different configurations of flash thermograpy systems. From left to right: The first photograph shows a high-end system that was developed for a military application. All systems components are integrated into military style flight cases. That particular system was equipped with six flash generators (blue devices). Each generator delivers 6 kJoule of flash energy for a total of 24 kJoule. The photo next to it shows a combination flash thermography system with transient thermography capability. That system is integrated into a standard flight case with casters. The photo to the right shows a FLIR camera on a tripod next to a flash lamp on a tripod. The setup was used to inspect aircraft propellers for defects. The photo on the very right shows a result image from one of the propellers with an edge defect – a delamination.

flash thermography system millitary MoviTHERM flash thermography system in flightcase flash thermography of propeller blades flash thermography result of propeller blade delamination

How is a flash thermography measurement performed?

The following video shows an overview and demonstration of our flash thermography system. For this demonstration we were using a pre-impregnated (“Prepreg”) carbon composite sample with three plies. Inside the sample there was a triangular piece of poly-film to simulate a defect or foreign object (“FOD”). This is a very typical scenario in today’s composite manufacturing industry. Smaller pieces of poly film sometimes get stuck or left behind from the backing material of the prepreg. The leftover piece of the peel-ply then becomes part of the carbon-composite layup or sandwich. Depending on the size of the FOD, this may lead to structural issues in the finished part. This is especially true for carbon composite structures that are exposed to high-stress. These pieces of peel-ply typically go unnoticed until much later, when the finished part is undergoing a final non-destructive test regimen, typically with ultrasonic testing. Detecting FODs this late can become very costly, as some parts may have to be scrapped.

Flash Thermography on the other hand, can be applied to the uncured prepreg and provides a quick verification of the layup prior to curing the part. Typically, a flash thermography system can detect FODs to about three plies deep. The heat injected into part from the flash is negligible and will not start the curing process prematurely.

A measurement only takes a couple of seconds, as can be seen in the video. This process can be further automated for larger and curved parts, using a collaborative robot and some of MoviTHERM’s automated image processing solutions.

Flash Thermography is very well suited for surface and near surface defects. However, it is very depth limited in materials that do not conduct heat very well, such as composites. The maximum penetration depth is typically around 1.5 to 2 mm for such materials. If the material thickness exceeds 2mm, we recommend switching to a transient thermography solution instead.

Signal Processing – The key to achieving good results!

The photo below shows a result image of a flash thermography measurement. The sample is a carbon composite coupon with flat holes of different depth. Two cursors have been placed on the image to measure temperature vs. time. The red cursor has been placed (baseline) over a non-defective area. The corresponding graph is blue. The green cursor has been placed over a “void”, represented by a flat hole. The graph color for this cursor is orange.

At time time zero, the flash introduces a sharp rise in temperature over the non-defective area as well as over the void. When the part starts to cool off, the orange graph clearly departs from the blue, indicating a different cooling behavior. The two graphs meet again when the part has reached equilibrium around ambient temperature. The difference in the rate of cooling is being exploited with an advanced signal processing technique. In fact, our Flash Thermography system offers several signal processing algorithms to choose from. The signal processing math is applied to every pixel in the image for the entire recorded video sequence.

Areas with different cooling behavior will be converted into a different gray level, resulting in a change in contrast and brightness for non-homogeneous areas in the material. The graph below only demonstrates the signal for two pixels in the image for a simplified illustration. The Y-axis in the graph area calculated units and not temperature. The X-axis are the number of images recorded.

temperature decay diagram

Flash Thermography Temperature Decay

How large of an area can be inspected?

When determining the size of the inspection area, several things need to be considered:

a) The spatial resolution of the thermal camera
b) The size of the flash lamp and the area it can uniformly illuminate
c) The geometry of the part

Spatial Resolution of Camera vs. Smallest Defect Size

The available number of pixels of the camera are being projected onto the part surface. These are contained within the field of view of the camera, which determines the size of the inspection area. For example, a camera may have a detector with 640 x 512 pixels. Any given defect needs to be covered with a minimum of 3 x 3 pixels, ideally more. If the smallest defect size of concern is 0.25″, this would result in 0.25″/3 = 0.08″/pixel. If we multiply this by the horizontal camera resolution, we get the total area we can inspect in one measurement. 0.08″/pixel x 640 pixels = 51.2″. For the vertical size of the field of view, we take 0.08″/pixel x 512 pixels = 40.96″. So the largest field of view size for a single measurement can therefore be ~50′ x 41″.

This is a rather large area. However, we also need to be concerned with how large of an area our flash lamp can cover and produce a uniform heat rise. This may require 2 to 4 flash lamps. With a single flash lamp we can reasonably achieve about 14″ x 12″.

Part Geometry

The part geometry also plays an important role when considering the total size of the inspection area. Curved surfaces can lead to non-uniform illumination of the flash light as well as reflections. Parts with complex geometries may require multiple smaller inspection regions compared to flat surfaces.

Depth Limitation

There are two depth limitations to consider. The first is a limitation due to thermal conductivity of the material. For example, a carbon composite material does not conduct heat very well. A flash lamp discharges all of its energy within 2 msec onto the surface of the part. A purely conducting (heat) material will prevent the thermal wave from penetrating the part very deeply. A rule of thumb is that flash thermography is limited to about 1.5mm to 2.0mm in penetration depth.

The second limitation comes from a ratio of the defect size to its depth in the part.

Depth limitation (diameter/depth) = ~1.4

The 1.4 factor does not consider any advanced signal processing techniques being applied to the result images. So this ratio can be improved to 1.0 to 1.2, depending on various factors. What this ratio says is that the diameter of the defect needs to be at least as large as its depth. However, as we have learned, the penetration depth for flash thermography is often limited much sooner by the thermal conductivity of the material. However, in order to inspect for defects in composites that are located deeper than about 2mm, we can utilize transient thermography instead. Transient thermography allows us to overcome this depth limitation. Another alternative to Flash Thermography is Lockin Thermography.

Example Flash Thermography Application

Defect coupon with flat holes Defect coupon with flat holes

This is an example application of a flash thermography inspection. The image on the left shows a sample coupon. There are several flat bottom holes drilled into the coupon with varying sizes of diameter and depth. This is a typical test and verification coupon to make sure the flash thermography system is working as expected. It is always a good practice to validate the system with a known standard, before proceeding to inspect critical parts.

The image on the right shows the results from the flash thermography measurement. The holes show up as dark circles. Some of the more shallow ones fade out and some do not show up at all anymore. The ones that do not show up are deeper than about 2mm and exceed the penetration limit of a flash thermography method.

Do you have parts that could benefit from a flash thermography inspection?

MoviTHERM offers NDT Feasibility Studies to help our customers evaluate their application challenges and how well an thermal, infrared non-destructive test method will perform. Learn more about our feasibility study offering!

The image on the right shows the results from the flash thermography measurement. The holes show up as dark circles. Some of the more shallow ones fade out and some do not show up at all anymore. The ones that do not show up are deeper than about 2mm and exceed the penetration limit of a flash thermography method.

Download Our Starter Guide

For Infrared NDT Systems

Infrared Non-destructive Testing Guide
  • Learn how Infrared NDT works

  • Learn what type of defects you can find

  • Learn how large of an area you can inspect

  • Learn how this method compliments UT inspections

  • Learn how to save valuable inspection time

2024-08-16T17:24:28-07:00Thursday, March 21, 2024|Blog|

Thermography Terms

Glossary of Thermography Terms

Absorption

Amount of radiation absorbed by an object relative to the received radiation. A number between 0 and 1.

Ambient

Objects and gases that emit radiation towards the object being measured.

Atmosphere

The gases between the object being measured and the camera, normally air.

Autoadjust

A function making a camera perform an internal image correction.

Autopalette

The IR image is shown with an uneven spread of colors, displaying could objects as well as hot ones at the same time.

Blackbody

Totally non-reflective object. All its radiation is due to its own temperature.

Blackbody Radiator

An IR radiating device with blackbody properties used to calibrate IR cameras.

Calculated Atmospheric Transmission

A transmission value computed from the temperature, the relative humidity of the air, and the distance to an object.

Cavity Radiator

A bottle shaped radiator with an absorbing inside, viewed though the bottleneck.

Color Temperature

The temperature for which the color of a blackbody matched a specific color.

Conduction

The process that makes heat spread into material.

Continuous Adjust

A function that adjusts the image. The function works all the time, continuously adjusting brightness and contrast according to the image content.

Convection

The process that make hot air or liquid rise.

Difference Temperature

A value that is the result of subtraction between two temperature values.

Dual Isotherm

An isotherm with two color bands instead of one.

Emissivity

The amount of radiation coming from an object compared to that of a blackbody. A number between 0 and 1.

Emittance

Amount if energy emitted from an object per unit of time and area (W/m2)

Estimated Atmospheric Transmission

A transmission value, supplied by a user, replacing a calculated one.

External Optics

Extra Lenses, filters, heat shields etc. that can be put between the camera and the object being measured.

Filter

A material transparent only to some of the infrared wavelengths

FOV

Field of view. The horizontal angle that can be viewed through an IR lens.

FPA

Focal plane array: A type of IR detector

Graybody

An object that emits a fixed fraction of the amount of energy of a blackbody for each wavelength

IFOV

Instantaneous Field of View: A measure of the geometrical resolution of an IR camera.

Image Correction (Internal Or External)

A way of compensating for sensitivity differences in various parts of live images and also stabilizing the camera.

Infrared

Non-visible radiation, with a wavelength from about 2-13 microns.

IR

Infrared.

Isotherm

A function of highlighting those parts of an image that fall above, below, or between one or more temperature intervals.

Isothermal Cavity

A bottle-shaped radiator with a uniform temperature viewed through the bottleneck.

Laser LocatIR

An electrically powered light source on the camera that emits laser radiation in a thin, concentrated beam to point at certain parts of the object on front of the camera.

Laser Pointer

An electrically powered light source on the camera that emits laser radiation in a thin, concentrated beam to point at certain parts of the object in front of the camera.

Level

The center value of the temperature scale, usually expressed as a signal value.

Manual Adjust

A way to adjust the image by manually changing certain parameters.

NETD

Noise equivalent temperature difference. A measure of the image noise level of an IR camera.

Noise

Undesired small disturbances in the infrared image.

Object Parameters

A set of values describing the circumstances under which the measurement of an object was made and the object itself (such as emissivity, ambient temperature, distance etc.)

Object Signal

A non-calibrated value related to the amount of radiation received by the camera from an object.

Palette

The set of colors used to display an IR image.

Pixel

A picture element. One single spot in an image.

Radiance

Amount of energy emitted from an object per unit of time, area, and angle (W/m2/sr).

Radiant Power

Amount of energy emitted from an object per unit of time (W).

Radiation

The process by which electromagnetic energy is emitted by an object or gas.

Radiator

A piece of IR radiating equipment.

Range

The current overall temperature measurement limitation of an IR camera, Cameras have several ranges, which are expressed as two blackbody temperatures that limit the current calibration.

Reference Temperature

A temperature which the ordinary measured values can be compared with.

Reflection

The amount of radiation reflected by an object relative to the received radiation. A number between 0 and 1.

Relative Humidity

Percentage of water in the air relative to what is physically possible. Air temperature dependent.

Saturation Color

The areas that contain temperatures outside the present level/span settings are colored with the saturation colors. The saturation colors contain an “overflow” color and an “underflow” color. There is also a third red saturation color that marks everything saturated by the detector indicating that the range should probably be changed.

Span

The interval of the temperature scale, usually expressed as a signal value.

Spectral (Radiant) Emittance

Amount of energy emitted from an object per unit of time, area, and wavelength.

Temperature Range

The current overall temperature measurement limitation of an IR camera. Cameras can have several ranges. They are expressed as two blackbody temperatures that limit current calibration.

Temperature Scale

The way in which an IR image currently is displayed. Expressed as two temperature values limiting the colors.

Thermogram

Infrared image.

Transmission (Or Transmittance) Factor

gases and materials can be more or less transparent. Transmission is the amount of IR radiation passing through them. A number between 0 and 1.

Transparent Isotherm

An isotherm showing a linear spread of color, instead of covering the highlighted parts of the image.

Visual

Refers to the video mode of an IR camera as opposed to the normal, thermographic mode. When a camera is in video mode it captured ordinary video images, while thermographic images are captured when the camera is in IR mode.

2024-08-16T17:24:37-07:00Thursday, March 21, 2024|Blog|

3D Printing and the Advantages of Thermal Monitoring

Advantages Thermal Monitoring Used for 3D Printing

Additive Manufacturing – an Overview

The world of 3D printing, otherwise known as ‘Additive Manufacturing’ (AM) has experienced a significant boost in recent years. The industry is forecasted to grow to approximately 10.8 billion dollars by 2021, up from 2.2 billion in 2012. Modern technology can now print everything from houses to machine parts in 3D. It is expanding well beyond the notion of everyday people printing their individual projects in their own homes into a sprawling industrial sector. 3D printing is massively increasing on an industrial scale.

NASA, for example, has designed two 3D printers to be sent into space to operate in zero gravity for the International Space Station. 3D is also being used in medical applications to create implants and prosthetics. Architectural elements are created to further design capabilities. A multitude of prototypes are being created every day across many industries. These are just as a few examples of the versatility of 3D printing.

Essentially, all 3D printing involves the laying down of various materials from polymers, metals, to fiber ceramics, layer by layer until the printing process is complete. There is a large degree of materials and methods available to print with dependent on the application the printed item is destined for. The various materials used include ABS plastics, PLA, polyamide (nylon), glass filled polyamide, silver, steel, titanium, photopolymers, and polycarbonate.
3d printer hand

Additive Manufacturing Methods

A few of the methods used in Additive Manufacturing include the following:

  • Fused Deposition Modeling, or FDM: Heats a thin filament of thermoplastic material depositing it layer by layer until the object is completed
  • Large Scale Polymer Deposition: Heats polymer pellets to their melting point then extrudes these polymers layer by layer until the printing process is complete
  • Laser Blown Powder Deposition (Laser Metal Deposition): Uses an inert gas to spray metal powder into a melt pool created by a laser.
  • Electron Beam Melting: Melts metal powder in layers that are bonded with a computer -controlled electron beam.
  • Selective Laser Sintering: Uses a high-powered laser to fuse small particles of plastic, metal or ceramic into a mass with 3 dimensional properties.

Additive versus Subtractive Manufacturing

The primary advantage of Additive Manufacturing is its cumulative creation process. This provides a much greater flexibility for producing complex geometrical shapes as opposed to taking a piece of raw material and removing from it to create what is needed.

When machining, milling, sawing, filings are involved, all these processes are considered ‘Subtractive Manufacturing’, sometimes called CNC, which produces a considerable amount of waste in comparison to an Additive Manufacturing process.

A 3D Printer Being Monitored by a Thermal Camera

A 3D Printer Being Monitored by a Thermal Camera

However, both processes have their challenges. While Subtractive Manufacturing may be somewhat wasteful and limited to the “machinable” geometries, Additive Manufacturing also has its downside. Process parameters are much more difficult to control, primarily critical temperatures. Nevertheless, thanks to thermal imaging, Additive Manufacturing can be carefully monitored in order to produce a better product.

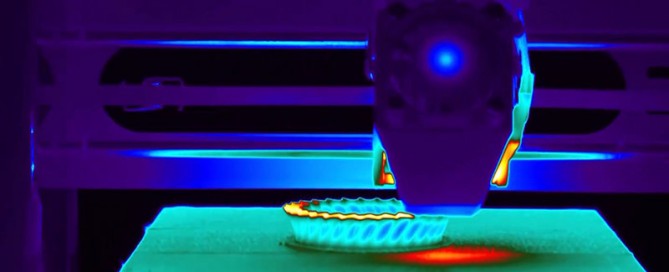
Parts manufactured using additive methods, such as 3D printing, can often involve imperfections in the manufacturing process creating issues like open voids, slippage between layers, thermal stresses, and to some extent crystallization of printed materials. Generally speaking, Additive Manufacturing requires a lot of trial and error during a new part setup. With thermal imaging, the printing extruder head and printed materials can be observed as the printing is taking place. This is helping to point out any issues in the process and can help operators fine tune their processes and create a better product.

Thermal Camera Selection for Additive Manufacturing

When selecting a thermal camera for measuring critical process temperatures, several factors need to be considered. First and foremost, the actual printing process and materials involved will determine, which type of thermal camera needs to be employed. For example, in a laser metal deposition application, very high temperatures are present, related to the melting temperature of the metal powders involved. This requires a thermal camera capable of measuring extremely high temperatures without saturating the image detector. Additionally, due to the rapid thermal conductivity in metals, a suitable thermal camera needs to have the capability of very short detector integration times. This is necessary in order to capture rapidly changing temperatures.

When dealing with polymer-based printing processes, these requirements are much more relaxed. Melt temperatures are much lower and so are thermal conductivity of these types of materials. This typically allows the use of much more affordable thermal imaging cameras with microbolometer type detectors.

Thermal imaging cameras can significantly improve the printing process, especially when integrated as a sensory feedback mechanism in a closed loop control for Additive Manufacturing processes. They can also dramatically reduce the setup time of the first article and perform in-situ process monitoring, control as well as quality assurance.

2024-08-16T17:24:44-07:00Thursday, March 21, 2024|Blog|

Thermal Monitoring for Server Rooms

Server Room Thermal Monitoring

Information is the lifeblood of modern business. Data continuity and availability is critical to maintaining the integrity our communication networks, security systems, banking, and industrial sectors. When equipment failure strikes a mission-critical data center, costs mount quickly. At large, distributed IT facilities, unplanned failures can cost millions. In smaller, organizations dollar values may be less dramatic, but the loss of productivity and competitive advantage may be significant.

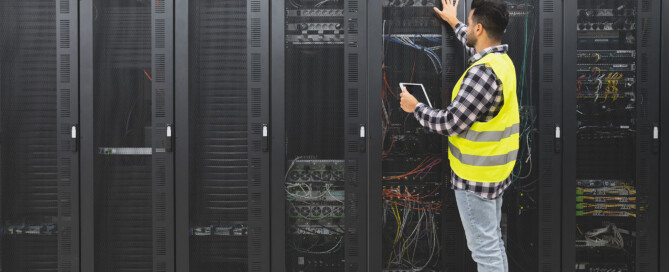
Regardless of the size of your IT installation, there will be a multitude of components that can potentially fail at any time. Electrical connections, cabling, component power supplies, rack units, uninterruptable power supplies (UPS), cooling systems, heat exchangers and other devices all contribute to keeping you data flowing smoothly. An unexpected failure on any node can bring down the entire system. Actively monitoring the integrity of your system components can give you advance warning of trouble, so you can take proactive action, before equipment failures can lead to a costly, unexpected system outage.

Infrared (IR) cameras can be an extremely effective tool for monitoring and predicting electrical equipment failure. When the thermal fingerprint of a component changes unexpectedly, this often indicates that a failure is underway. Deploying IR cameras to monitor your critical equipment can be a very effective first line of defense against unexpected and unplanned downtime.

Electrical Substation Monitoring

Figure 1: 100% 24/7 uptime reliability is critical for state-of-the-art server installations.

The MoviTHERM Server Room Thermal Monitoring Solution

In response to the need for 100% server uptime reliability, MoviTHERM has developed an integrated Server Room Monitoring solution. This integrated system solution has been designed to address the specific needs of data center monitoring. Using a combination of advanced thermal imaging and proven, off-the-shelf components, the MoviTHERM Server Room Monitoring system provides all the tools you need to detect problems early — before they turn into costly and potentially critical network failures.

Electrical Substation Monitoring

Figure 2: Unexpected “hot spots” in thermal images may indicate signs of trouble.

The FLIR AX8 Camera – Thermal Sensor on Steroids

The FLIR AX8 is a hybrid thermal sensor with advanced imaging capabilities. Combining thermal and visual cameras in a small, affordable package, the FLIR AX8 provides continuous temperature monitoring and alarming for of critical electrical and mechanical equipment.

Electrical Substation Monitoring

Figure 3: FLIR AX8 Camera

The basic system comes with four (4) AX8 cameras, which can be mounted strategically to monitor large areas, or specific critical components. Cameras can be configured to monitor temperatures and watch for unexpected “hot spots”. The cameras’ built-in analysis and alarm functions work in tandem with the other system components to alert support personal when remedial action is required.

The FLIR AX8 Camera – Thermal Sensor on Steroids

The MoviTHERM MIO-8 acts as the traffic cop, or the central processing hub of your system. The MIO processes data from the cameras, and sets the digital (relay) and/or analog (4-20mA) outputs to trigger audible alarms, turn on warning lamps, launch auto-dialer alerts, , or activate any other type of electrical warning device. The device is easily configured using a browser-based configuration tool. It’s quick to set-up, and a snap to modify the response profile.

Electrical Substation Monitoring

Figure 4: Multi-function I/O – MoviTHERM MIO-8

FLIR NVR – Your Window Into the Invisible

The FLIR Network Video Recorder (NVR) displays the live video feeds from the FLIR thermal cameras on a video display screen. In addition, the NVR can be configured to display on-screen warnings and alarm indications. If you enable the Video Archiving function, you can save several months of video on-board, for historical review and issue analysis. Add an Internet connection to the NVR, and your monitoring system can be access from anywhere in the world using the FLIR Cloud technology. Log in to check the live view, or review alarms remotely, using a PC, Mac, Android, or Apple iOS device running the free FLIR Cloud app.

Electrical Substation Monitoring

Figure 5: FLIR NVR (Network Video Recorder)

appstores

Unlimited Interfacing Potential

Connect to warning lights, audible alarms, auto-dialers, PLC controllers — any type of electrical or control device you can imagine. The MoviTHERM Server Room Thermal Monitoring System provides the intelligent sensor capabilities, Built-in Operator Interface/video wall, and data archiving capabilities in a clean, well-organized package.

Easy to install, and easy to configure, the MoviTHERM Server Room Thermal Monitoring System is your shortest path to a robust, cost-effective, full-featured Server Room Thermal Monitoring solution!

2024-08-16T17:24:54-07:00Thursday, March 21, 2024|Blog|

Electrical Substation Monitoring

Electrical Substation Monitoring Using Infrared

Electrical Substation is Becoming a Very Important Task

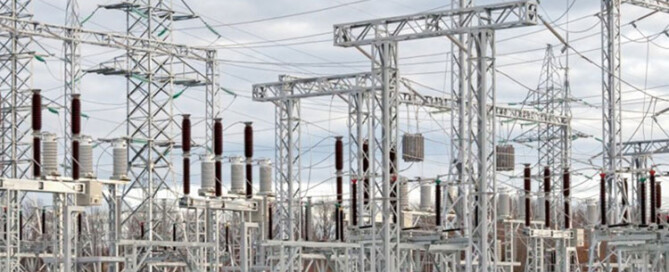
Keeping the lights on and the power distribution grid running are critical to maintaining our modern way of life. Everything depends on the power grid; from our food and water supply, to the factories, networks, security systems, and banking industries that we all rely on every day to keep our world on track. No aspect of our modern societies can function without power.

However, power utility companies are facing increasing pressures. Aging infrastructure and increasing demand for low-cost energy are putting more stress on the power grid, increasing the risks of costly and potentially devastating brownouts and blackouts. At this critical time, utilities need solid solutions to help increase capabilities, maintain reliability, while at the same time, keeping costs under control.

Electrical Substation Monitoring

Figure 1: Substation face increasing technological and budgetary challenges.

MoviTHERM Substation Monitoring Solution

In order to meet these industry challenges, MoviTHERM has developed an integrated Electrical Substation Monitoring solution. Using a combination of advanced thermal imaging and proven, off-the-shelf components, the MoviTHERM Electrical Substation Monitoring system provides all the tools you need to detect problems early — before they turn into costly and potentially critical substation failures.

Electrical Substation Monitoring

Figure 2: “Hot spots” in thermal images indicate signs of trouble.

FLIR A310f – The Eyes of Your System

The FLIR A310f is a ruggedized, all-weather version of FLIR’s popular A310 thermal camera. The basic system comes with six (6) A310f cameras, which can be mounted strategically around your yard. Cameras should be located to monitor temperatures and watch for unexpected “hot spots” on critical electrical components.

Electrical Substation Monitoring

Figure 3: FLIR A310f Cameras

The cameras’ built-in analysis and alarm functions work in tandem with the other system components to alert substation personal when remedial action is required.

In addition, one or more of the cameras can be configured to scan for unauthorized intruder entry, increasing the security of your facility.

Electrical Substation Monitoring

MoviTHERM MIO-8 – The Brain of Your System

The MoviTHERM MIO-8 acts as the traffic cop, or the central processing hub of your system. The MIO processes data from the cameras, and sets the digital (relay) and/or analog (4-20mA) outputs to trigger audible alarms, turn on warning lamps, launch auto-dialer alerts, , or activate any other type of electrical warning device. The device is easily configured using a browser-based configuration tool. It’s quick to set-up, and a snap to modify the response profile.

Electrical Substation Monitoring

Figure 5: Multi-function I/O – MoviTHERM MIO-8

FLIR NVR – Your Window Into the Invisible

The FLIR Network Video Recorder (NVR) displays the live video feeds from the FLIR thermal cameras on a video display screen. In addition, the NVR can be configured to display on-screen warnings and alarm indications. If you enable the Video Archiving function, you can save several months of video on-board, for historical review and issue analysis. Add an Internet connection to the NVR, and your monitoring system can be access from anywhere in the world using the FLIR Cloud technology. Log in to check the live view, or review alarms remotely, using a PC, Mac, Android, or Apple iOS device running the free FLIR Cloud app.

Electrical Substation Monitoring

Figure 6: FLIR NVR (Network Video Recorder)

FLIR NVR (Network Video Recorder)

appstores

Unlimited Interfacing Potential

Connect to warning lights, audible alarms, auto-dialers, PLC controllers — any type of electrical or control device you can imagine. The MoviTHERM Substation Monitoring System provides the intelligent sensor capabilities, Built-in Operator Interface/video wall, and data archiving capabilities in a clean, well-organized package.

Easy to install, and easy to configure, the MoviTHERM Electrical Substation Monitoring System is your shortest path to a robust, cost-effective, full-featured electrical substation monitoring solution!

2024-08-16T17:25:12-07:00Thursday, March 21, 2024|Blog|

Infrared Everywhere

Celebrating 20 Years in Thermal

FLIR had a great discussion with Markus Tarin of MoviTHERM on his 20 year career in the world of thermal, the interesting work his team has done, and looking into the future of what’s possible with FLIR technology.

More about the mentioned projects:

1) Exposing Carbon Pollution | Cool Effect

2) MTV VMA 30 Seconds To Mars MTV Video Music Awards – How did they do that? and see the result on Youtube

3) Hyperice Lab: Increased Circulation with the Vyper 2.0 vs. Standard Foam Rolling

4) Seals on Ice Wildlife Research – “Snowflake”

5) MoviTHERM IR-NDT Solutions

5) Early Fire Detection in a laundry facility

More about Markus Tarin (President & CEO of MoviTHERM):

Markus Tarin has extensive experience with visible and non-visible imaging. Tarin was the lead architect on many product development projects for defense, research, medical and industrial applications. Through his company, he has commercialized many of these developments for remote monitoring, automated thermal imaging, and non-destructive testing. MoviTHERM is a FLIR Distributor and Integrator.


2024-03-26T16:27:05-07:00Thursday, March 21, 2024|News|
Go to Top